In today’s hyper-competitive restaurant industry, decision makers are constantly challenged by a flood of data coming from every corner of their operations. From fragmented sales figures and diverse payment methods to fluctuating product performance and varied staff efficiency, the sheer volume of information can be overwhelming. However, with the right tools and a strategic approach, raw data can be transformed into powerful insights that drive smarter, faster decisions. In this blog post, we explore how a comprehensive Power BI dashboard revolutionizes restaurant sales analytics, turning complexity into clarity and empowering leadership with actionable intelligence.
The Data Dilemma in Restaurants
Imagine running a restaurant where every transaction, every order, and every staff performance metric is recorded in a separate silo. The reality for many is this:
- Fragmented Data Sources: Sales transactions, payment methods, product performance, and staff efficiency data are often scattered across multiple systems. Without an integrated view, hidden patterns and trends go unnoticed, delaying crucial management decisions.
- Lack of Real-Time Visibility: Key metrics such as total revenue, order volumes, and average order value frequently reside in disparate reports. This fragmented setup means decision makers struggle to respond swiftly to emerging trends or unexpected issues.
- Insufficient Product & Category Insights: Knowing which food items or beverage categories fuel revenue—and which ones might be dragging the bottom line—is essential. Traditional, manual analysis methods can miss these nuances, leading to missed opportunities.
- Unclear Payment & Transaction Dynamics: With customers paying via various methods, understanding each channel’s contribution to overall revenue becomes vital. Without detailed transaction insights, pricing strategies can fall short.
- Operational & Staff Performance Challenges: The quality of service and profitability are heavily influenced by the performance of different shifts and staff members. When these details aren’t closely monitored, underperforming segments can easily slip under the radar.
Why This Matters for Leaders: By pinpointing critical operational pain points, decision makers gain the insight needed to prioritize integration and drive proactive, high-impact strategies.
Enter the Power BI Dashboard
To overcome these hurdles, a state-of-the-art Power BI dashboard was developed using synthetic Restaurant Sales data modeled on real-life operations. This interactive, multi-page report brings together all the essential data points into a single, user-friendly interface, making it easier than ever for top management to uncover actionable insights.
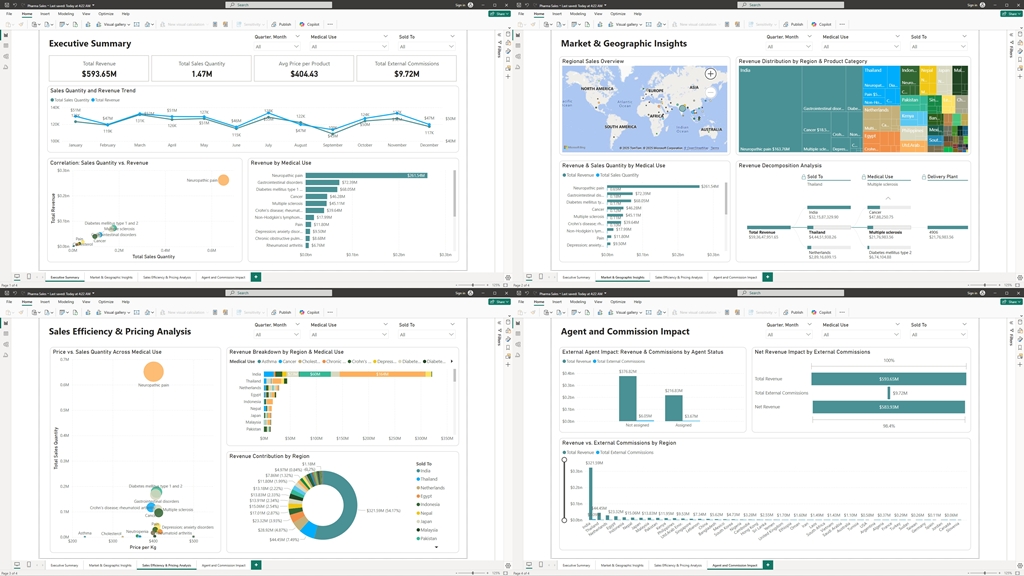
1. Executive Overview
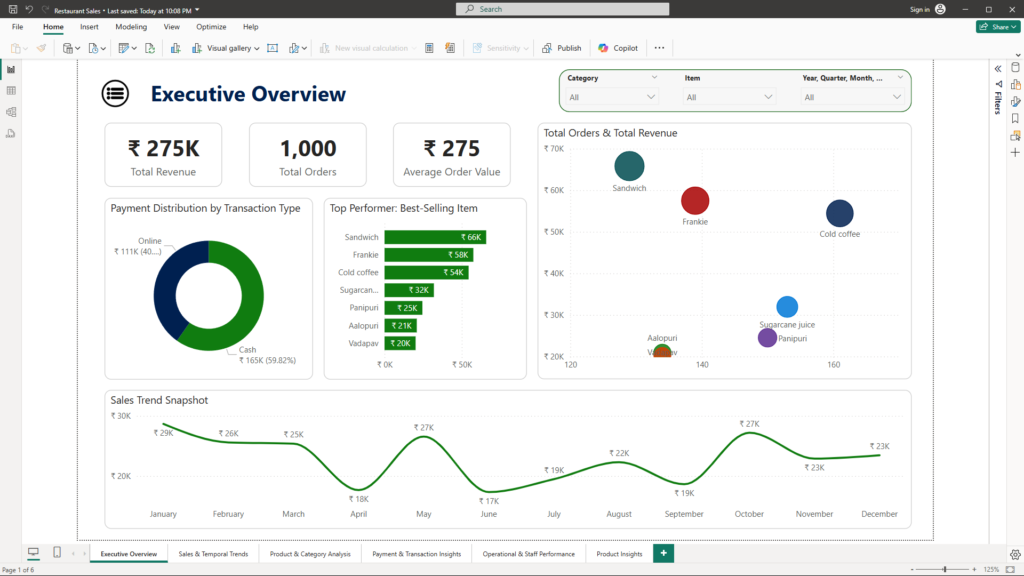
The journey begins with a high-level snapshot that provides an immediate sense of the restaurant’s overall performance:
- KPI Cards: Quick-glance metrics like Total Revenue, Total Orders, and Average Order Value offer an instant health check.
- Payment Distribution by Transaction Type: A pie chart breaks down the revenue contributions from various payment methods.
- Top Performer & Sales Trends: Visualizations such as bar charts and scatter plots pinpoint best-selling items and reveal correlations between orders and revenue.
- Interactive Slicers: Customizable filters (by Category, Item, and Time) allow for dynamic exploration, setting the stage for deeper analysis.
The Strategic Edge: This powerful overview enables leaders to rapidly gauge the business’s pulse, setting the foundation for informed, strategic decisions that keep operations agile and profitable.
2. Sales & Temporal Trends
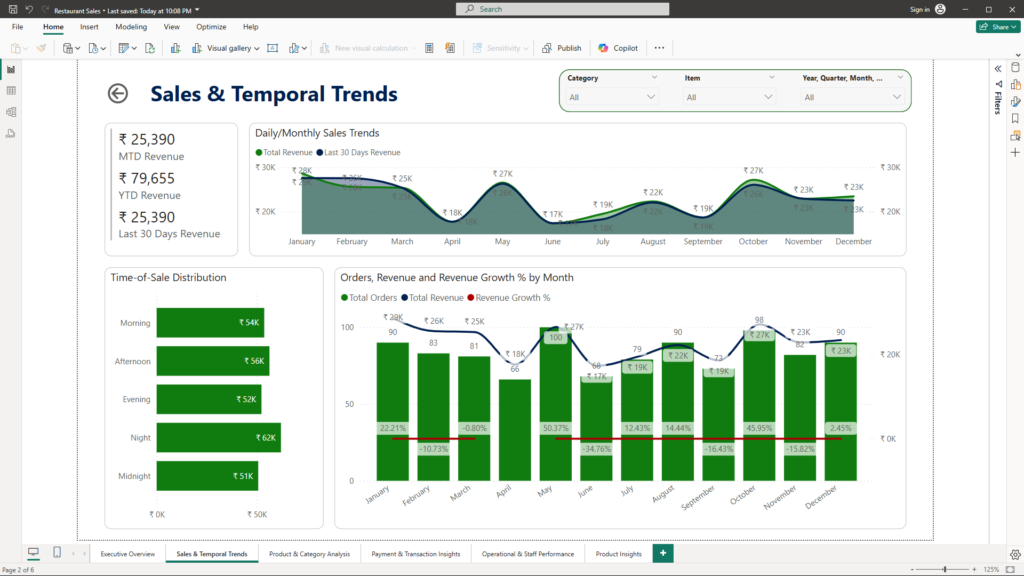
Understanding the rhythm of the business is critical:
- Period-Specific Snapshots: Metrics for month-to-date, year-to-date, and the last 30 days provide timely insights.
- Visualizing Sales Patterns: Area charts and combo charts illustrate daily and monthly sales trends, revealing seasonal patterns and peak periods.
- Time-of-Sale Distribution: By identifying which shifts (morning, afternoon, etc.) generate the most activity, restaurants can optimize staffing and operations.
Unlocking Growth Opportunities: With a clear view of temporal trends, decision makers can anticipate busy periods, optimize resource allocation, and craft marketing strategies that capture every opportunity.
3. Product & Category Analysis
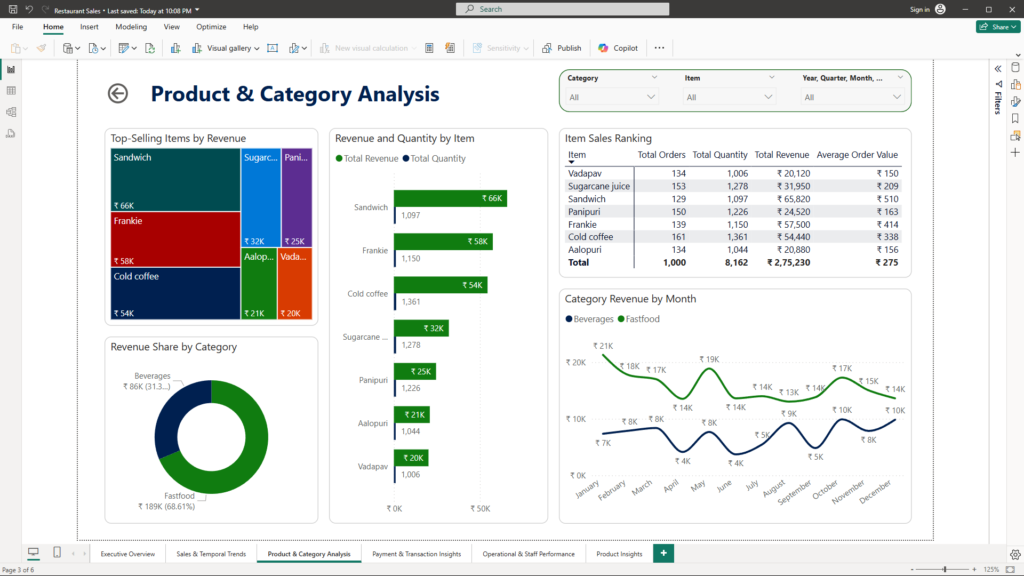
Digging into the specifics of what’s selling—and what isn’t—drives smart decision-making:
- Top-Selling Items: Tree maps and bar charts clearly rank items by revenue and volume, spotlighting the winners.
- Revenue Share by Category: Donut charts display how different product categories contribute to the bottom line, guiding menu optimization.
- Detailed Sales Ranking: A comprehensive matrix offers granular insight into product performance, empowering targeted marketing and inventory decisions.
Driving Menu Innovation: Armed with these insights, leaders can fine-tune offerings to spotlight high-margin products and strategically revamp underperforming segments, thereby maximizing profitability.
4. Payment & Transaction Insights
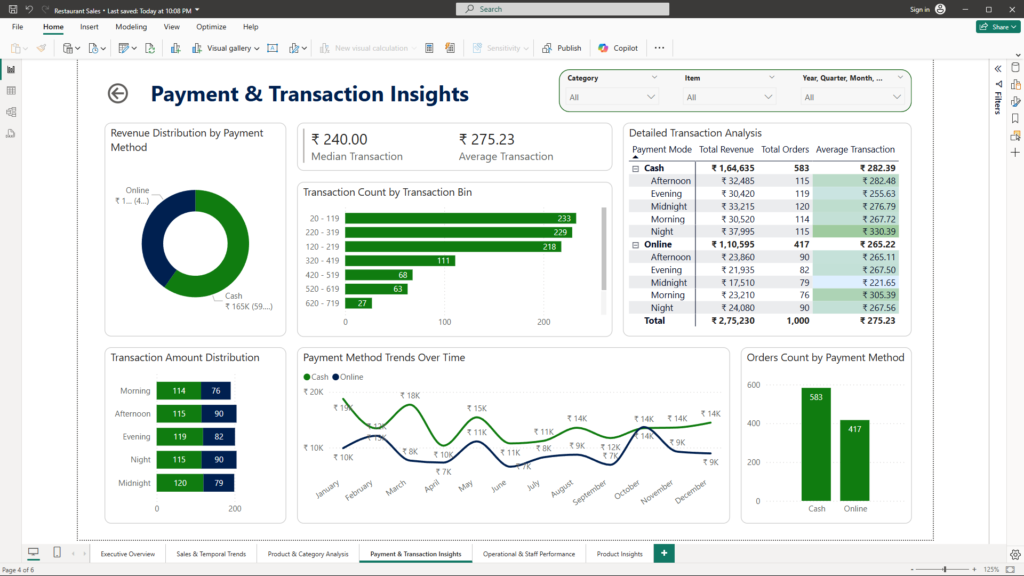
Customer payment behavior is more than just a number—it’s a story:
- Transaction Metrics: KPIs for median and average transaction values set the benchmark.
- Dynamic Visualizations: Donut and stacked bar charts, along with detailed matrices, uncover the nuances of payment methods and transaction distributions.
- Trend Analysis: Line and column charts track the evolution of revenue by payment type, ensuring pricing strategies remain aligned with customer behaviors.
Optimizing Revenue Streams: By diving deep into payment patterns, executives can refine pricing models, adjust payment strategies, and ensure that every transaction contributes optimally to the bottom line.
5. Operational & Staff Performance
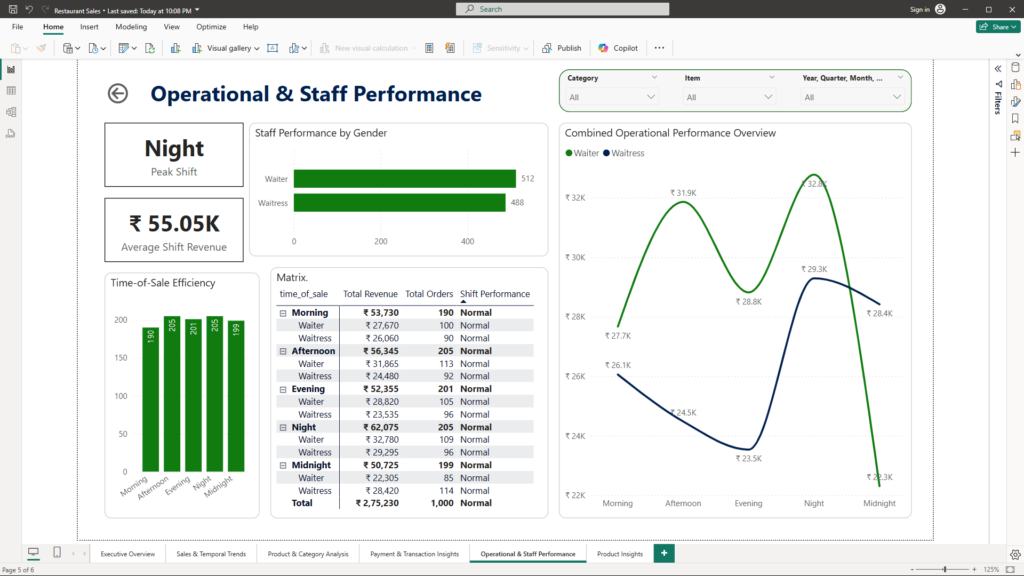
Efficiency and excellence in service are paramount:
- Shift Performance: KPI cards quickly identify peak shifts and average revenue per shift.
- Staff Insights: Bar charts compare performance across different staff demographics, providing a clear view of operational strengths and weaknesses.
- Operational Alerts: A matrix with conditional formatting flags anomalies and underperforming shifts, ensuring issues are addressed before they impact service quality.
Enhancing Operational Excellence: This section provides the tools to streamline operations and boost team performance, ensuring every shift and staff member contributes to an exceptional customer experience.
6. Product Insights Drill-through
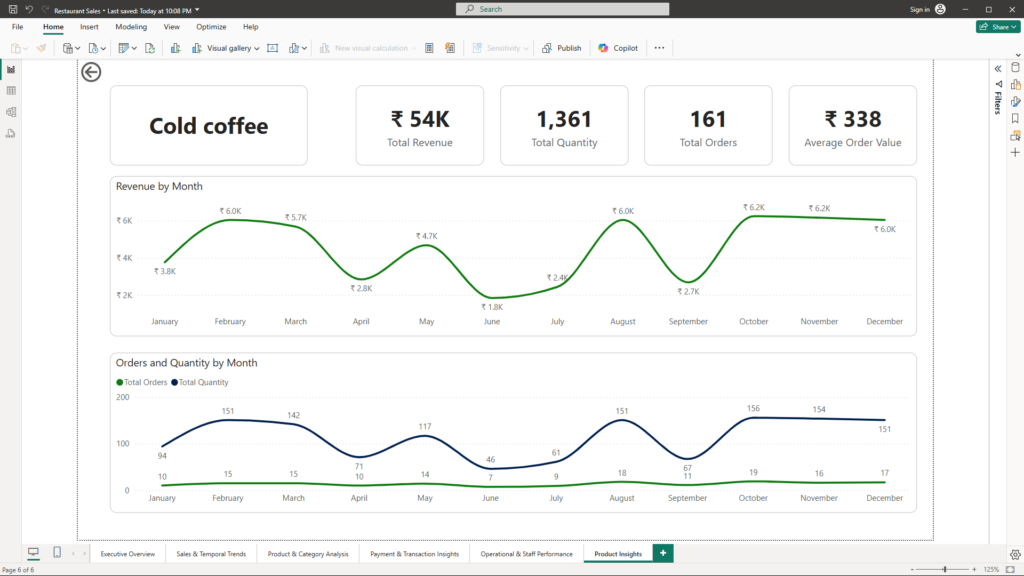
Sometimes, you need to zoom in for a closer look:
- Focused Analysis: Drill-through functionality allows users to click on a product from the main dashboard, accessing detailed insights such as historical performance and granular sales metrics.
- Empowering Decisions: This level of detail supports informed decisions around product development, targeted promotions, and inventory management.
Deep-Dive for Targeted Strategy: By enabling granular analysis of individual products, leaders can uncover hidden opportunities, drive targeted improvements, and craft strategies that resonate on a product level.
Conclusion
The Restaurant Sales dashboard powered by Power BI is more than just a reporting tool—it’s a strategic asset. By seamlessly integrating diverse data sources into one interactive platform, it empowers decision makers to quickly identify trends, respond to emerging issues, and make data-driven decisions that enhance operational efficiency and profitability. Each component of the dashboard is meticulously designed to translate complex data into clear, actionable insights that drive sustainable growth and competitive advantage.
Ready to Elevate Your Business?
If you’re a business owner looking to harness the full potential of your restaurant’s data, now is the time to transform insights into action. Discover how tailored Power BI solutions can drive strategic growth and operational excellence, providing you with the tools needed to make informed decisions every day.
For more information or a personalized consultation, contact me at: mail@ssghosal.com