Employee retention is not just about tracking numbers—it’s about seeing the story behind the data. In this case study, I’ll demonstrate how a suite of interactive Power BI reports uses compelling visualizations to provide top management with clear, actionable insights into employee attrition. The following sections highlight the visual elements of each report and explain the benefits they offer to strategic decision-makers.
1. Executive Summary: The Dashboard at a Glance
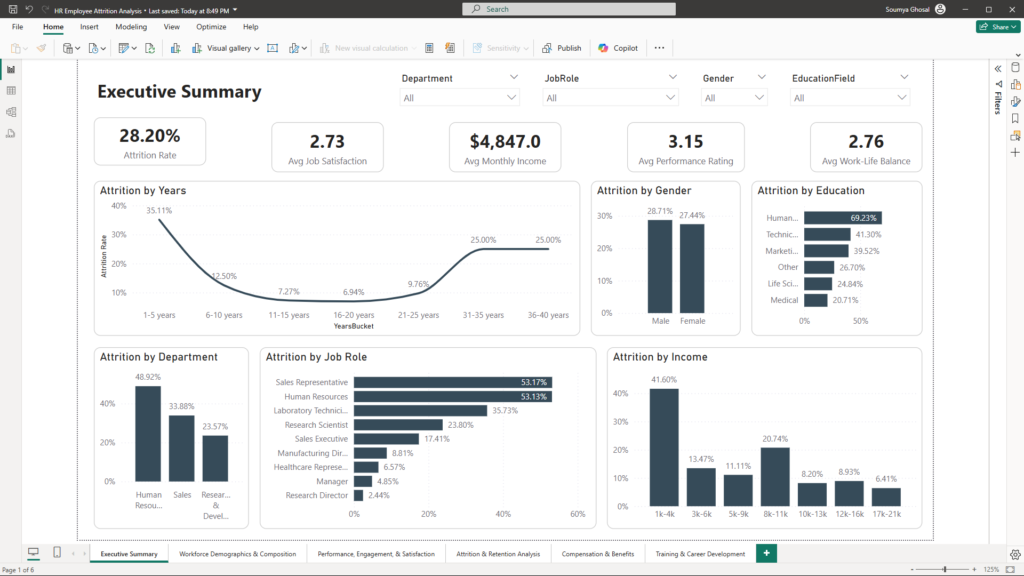
Visualizations:
- KPI Cards: Large, easy-to-read cards display critical metrics such as Overall Attrition Rate, Average Monthly Income, Job Satisfaction, Performance Rating, and Work-Life Balance Score.
- Interactive Slicers: Slicers for Department, Job Role, Gender, and Education Field allow users to dynamically filter data and instantly update all visuals on the page.
Benefits for Management:
Flexible Analysis: With interactive slicers, top management can tailor the view to focus on specific segments, enabling swift decision-making at a glance.
Quick Insights: The Executive Summary provides a real-time snapshot of overall HR performance.
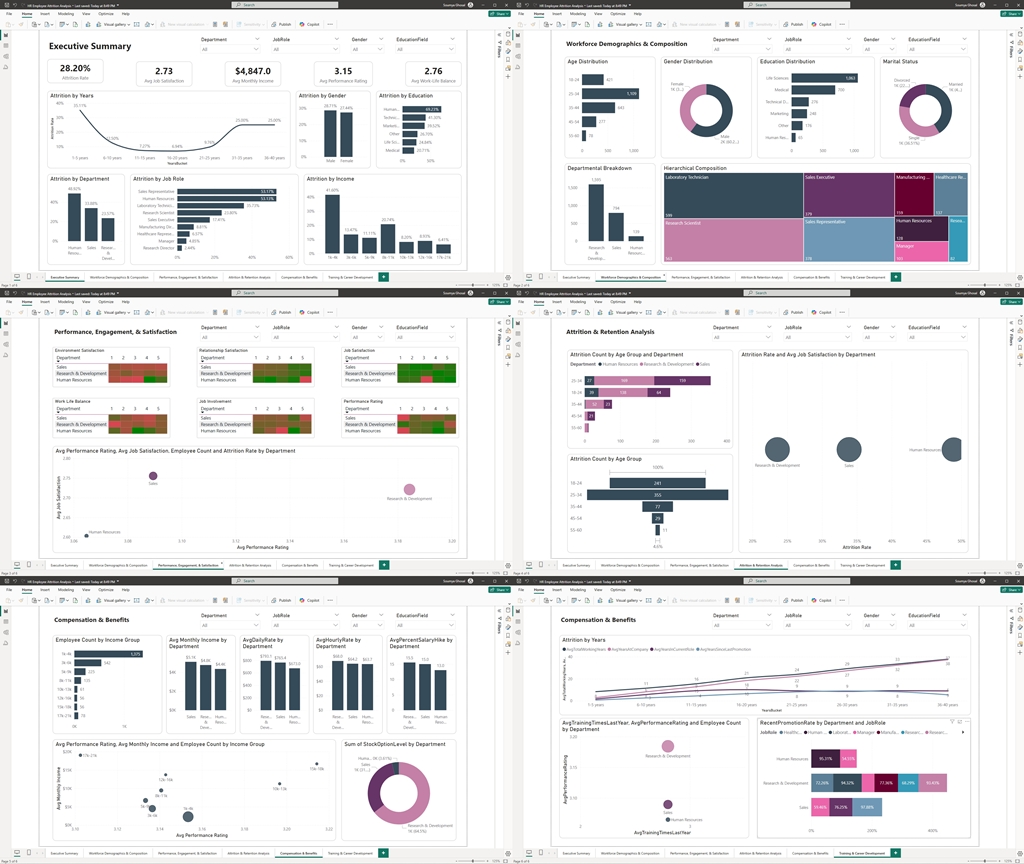
2. Workforce Demographics & Composition Report
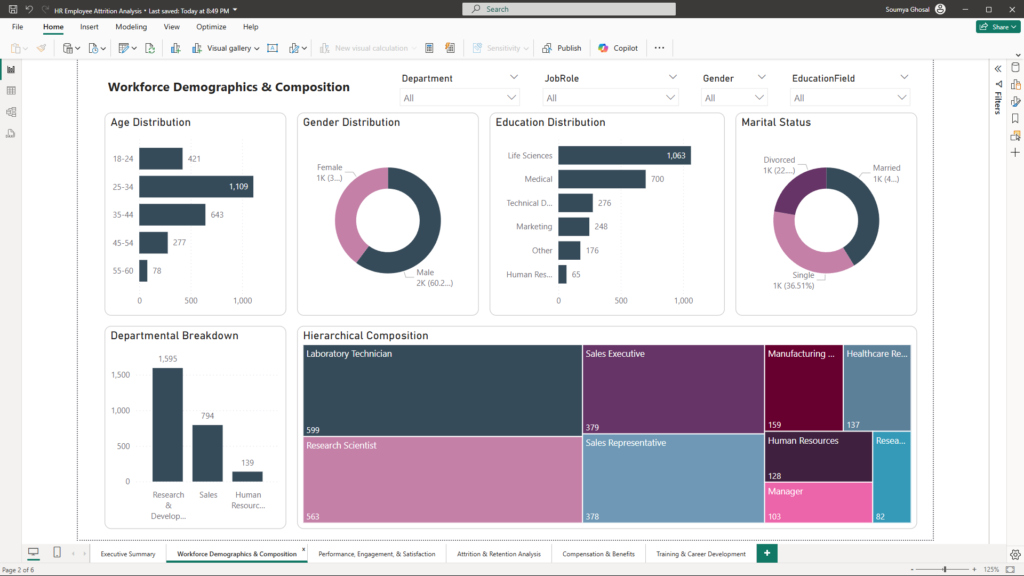
Visualizations:
- Bar and Pie Charts: These charts display proportions of employees across various demographic categories such as Age, Gender, and Education.
- Clustered Column Charts: Compare workforce composition across different Departments or Job Roles, making differences immediately visible.
- Treemaps: Present hierarchical data that shows the structure of the workforce in a compact, visually engaging format.
Benefits for Management:
- Diversity Assessment: Easily identify demographic distributions and potential representation gaps.
- Resource Allocation: Understand which segments require targeted HR initiatives, such as recruitment or retention strategies.
3. Performance, Engagement & Satisfaction Report
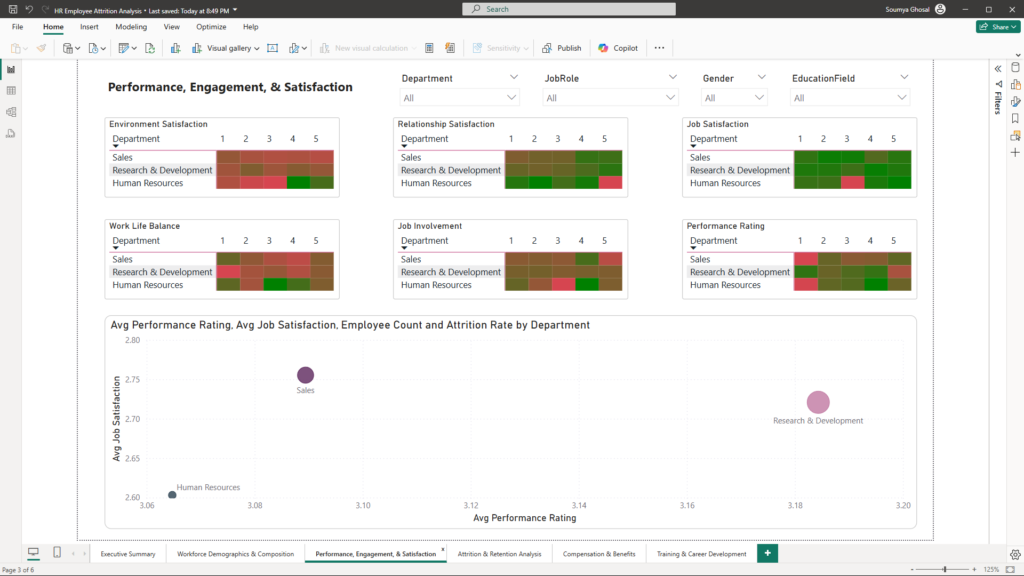
Visualizations:
- Heatmaps: Use color gradients to show varying levels of engagement (e.g., Environment Satisfaction, Job Involvement, Relationship Satisfaction) across departments or roles.
- Box Plots and Scatter Plots: Highlight trends and outliers in employee satisfaction and performance, making it simple to spot anomalies.
- Stacked Bar Charts: Visualize the distribution of satisfaction ratings, providing a clear picture of how different groups rate their experiences.
Benefits for Management:
- Early Warning Signals: Quickly detect departments where engagement may be lagging.
- Targeted Interventions: Identify outlier groups that might benefit from specific improvements or support programs.
4. Attrition & Retention Analysis
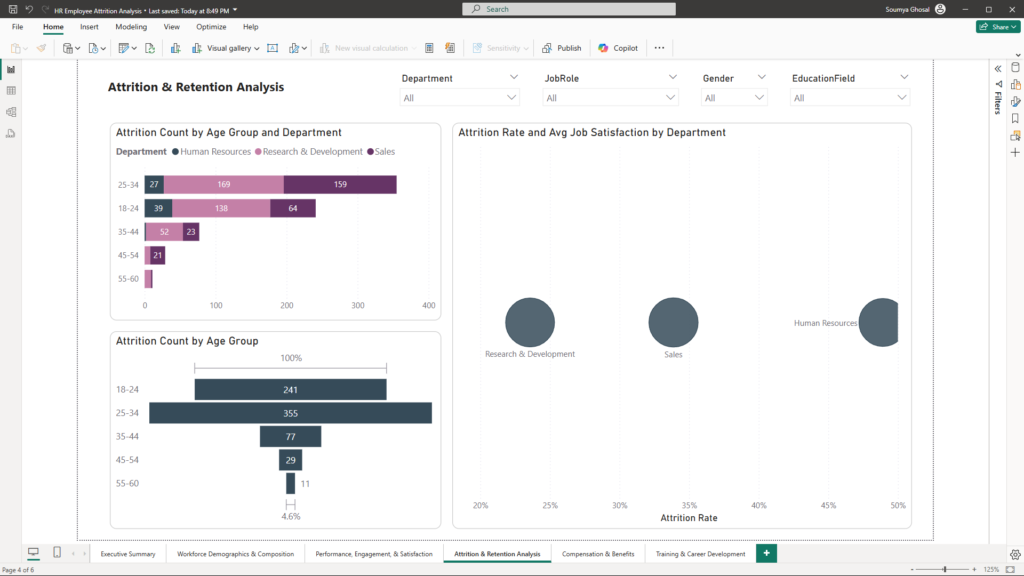
Visualizations:
- Funnel Charts: Illustrate the progression of employee attrition, highlighting the stages where losses occur.
- Correlation Matrices: Show potential relationships between factors such as overtime, job satisfaction, and attrition rates.
- Scatter Plots: Enable a visual comparison of metrics like overtime versus attrition, revealing patterns that might otherwise be hidden.
Benefits for Management:
- Identify Drivers: Pinpoint key factors that contribute to employee turnover.
- Strategic Focus: Use visual cues to decide where to focus retention efforts, such as workload management or career development.
5. Compensation & Benefits
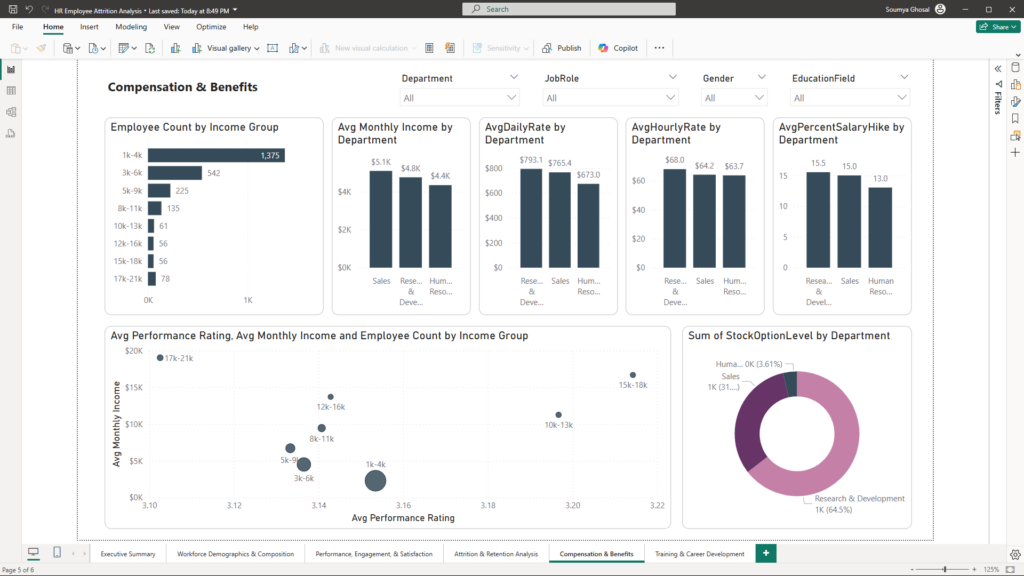
Visualizations:
- Histograms: Present the distribution of salary components (Monthly Income, Daily Rate, Hourly Rate), highlighting pay structure variations.
- Scatter Plots: Compare compensation against performance or satisfaction metrics, revealing potential misalignments.
- Bar Charts: Compare compensation figures across Job Levels, Departments, or Job Roles, making discrepancies easy to spot.
Benefits for Management:
- Fair Compensation: Visual insights help ensure compensation practices are competitive and equitable.
- Retention Strategies: Identify departments that may need revised compensation structures to retain top talent.
6. Training & Career Development Report
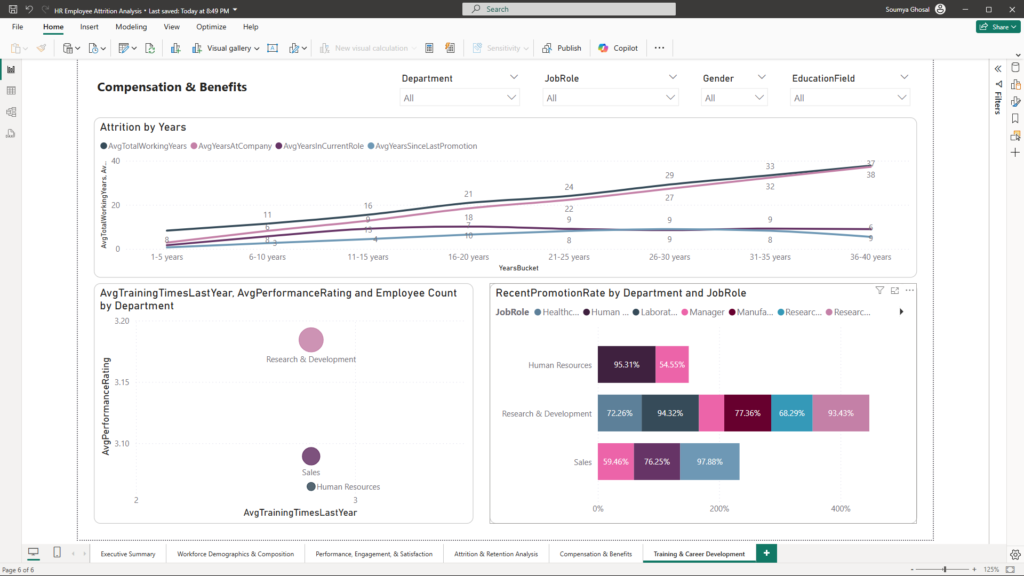
Visualizations:
- Line Charts: Display career progression metrics (Total Working Years, Years At Company, etc.) over different employee segments, offering a clear trend analysis.
- Scatter Plots: Correlate training frequency with performance ratings, demonstrating the impact of development opportunities on productivity.
- Bar Charts: Compare promotion rates across Departments, revealing where career growth may be stagnating.
Benefits for Management:
- Career Path Clarity: Visual trends help assess whether employees receive the necessary training and advancement opportunities.
- Proactive Development: Identify areas for enhanced training programs and mentorship initiatives, ensuring a robust pipeline for future leadership.
Leveraging Interactivity for Strategic Insights
One of the dashboard’s greatest strengths is its interactivity. By altering slicers—such as Department, Job Role, Gender, and Education Field—top management can instantly drill down into the data:
- Dynamic Filtering:
Instantly view tailored metrics for specific groups. For example, filtering by “Sales” might reveal that this department faces higher attrition due to excessive overtime. - Granular Analysis:
Combine multiple slicers to uncover deeper insights. Filtering by both Gender and Education Field within a particular Job Role can pinpoint subtle trends and guide targeted interventions. - Unified Insights:
With the Executive Summary providing an overarching view, management can quickly switch between different reports to see how workforce composition, engagement, attrition, compensation, and career development interrelate.
Conclusion: Turning Data into Strategic Action
This case study showcases how a well-designed Power BI dashboard can empower HR leaders to make data-driven decisions. By integrating detailed reports—from Workforce Demographics to Training & Career Development—the dashboard provides a comprehensive view of employee attrition and retention dynamics. The interactivity ensures that management can explore specific trends and implement targeted strategies to boost retention.
If you’re interested in harnessing the power of data analytics to transform your HR strategy, feel free to reach out at mail@ssghosal.com. Discover how a tailored Power BI solution can help you retain top talent and drive business success.