Introduction
In today’s dynamic market, understanding product sales in depth is critical for sustained growth and competitive advantage. A comprehensive sales analysis not only highlights the current performance but also reveals underlying trends and profit drivers that can inform strategic decisions. By leveraging interactive dashboards and targeted visualizations, businesses can transform raw data into actionable insights, enabling rapid response to market changes and optimization of sales channels.
Problem Statement
Many organizations face significant challenges in navigating their sales data:
- Inconsistent Metrics: Without a unified view, tracking key performance indicators (KPIs) becomes cumbersome, leading to misaligned strategies.
- Limited Trend Visibility: Isolated reports obscure seasonal trends and shifts in market dynamics, making forecasting and timely intervention difficult.
- Geographic Disparities: Sales performance often varies dramatically by region, yet many reports fail to capture these nuances.
- Product Segmentation Complexity: A lack of detailed insights into product performance can lead to missed opportunities in high-potential segments.
- Channel Effectiveness: Identifying the most profitable sales channels is challenging without a clear comparative analysis.
- Opaque Profitability Drivers: Without dissecting profit components, it’s hard to determine whether issues stem from pricing, volume, or operational margins.
How the Analysis Helps
A structured product sales analysis framework converts complex data sets into clear visual reports, enabling businesses to:
- Spot Trends & Seasonality: Identify seasonal fluctuations and emerging trends to optimize marketing and inventory planning.
- Target Geographic Hotspots: Determine regions with high performance and areas needing focused attention.
- Evaluate Product Performance: Understand which products are driving revenue and profitability, informing product development and promotional strategies.
- Optimize Sales Channels: Assess the efficiency and profitability of different channels, enabling strategic resource allocation.
- Break Down Profit Drivers: Decompose profit into price, volume, and margin components to support informed pricing and cost management decisions.
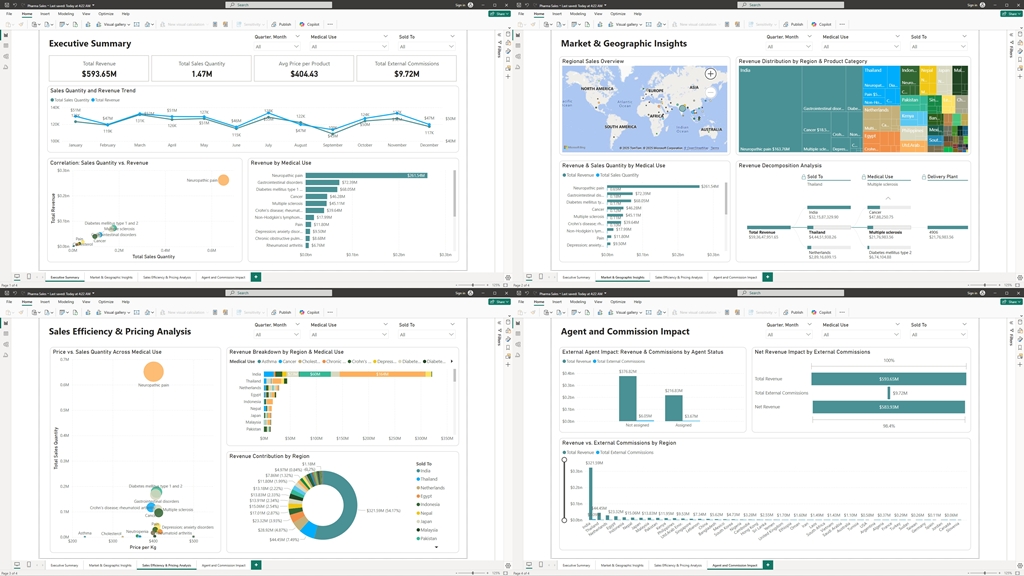
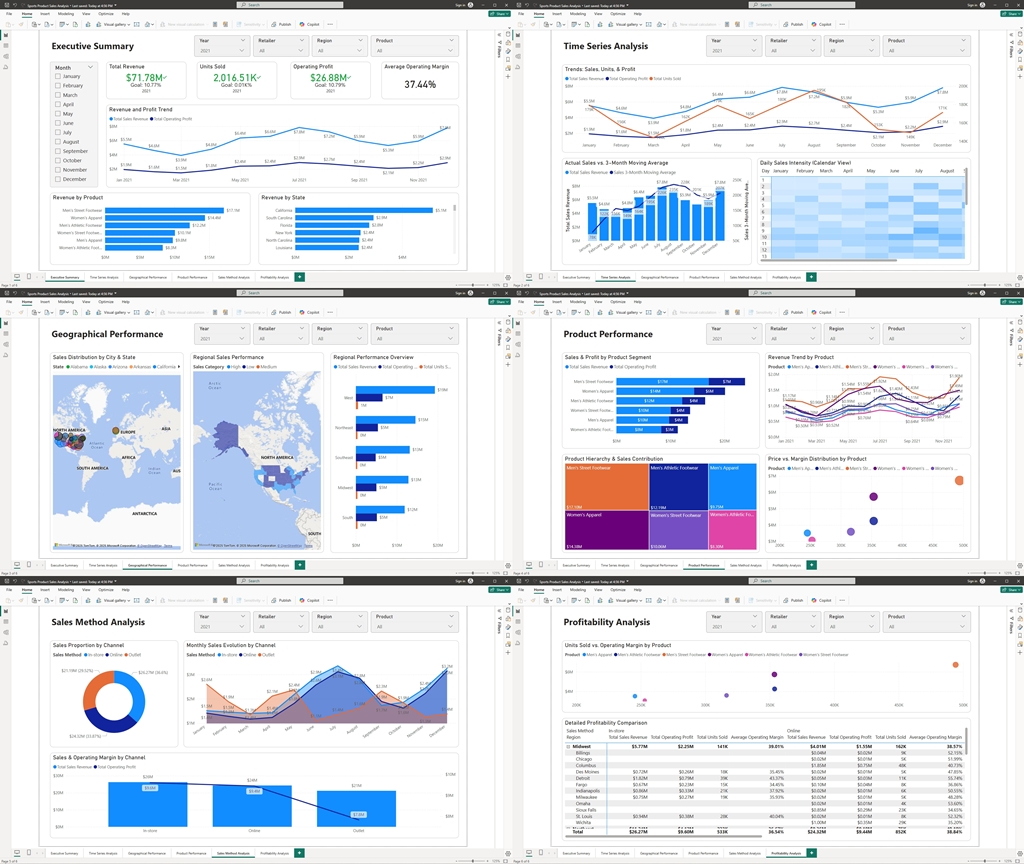
Report Overviews and Their Visuals
1. Executive Summary
Overview:
The Executive Summary provides a high-level snapshot of annual performance. Key metrics—Total Revenue, Units Sold, Operating Profit, and Average Operating Margin—are displayed alongside trend analyses that reveal revenue and profit trajectories. This report serves as the dashboard’s landing page, offering quick insights into overall business health.
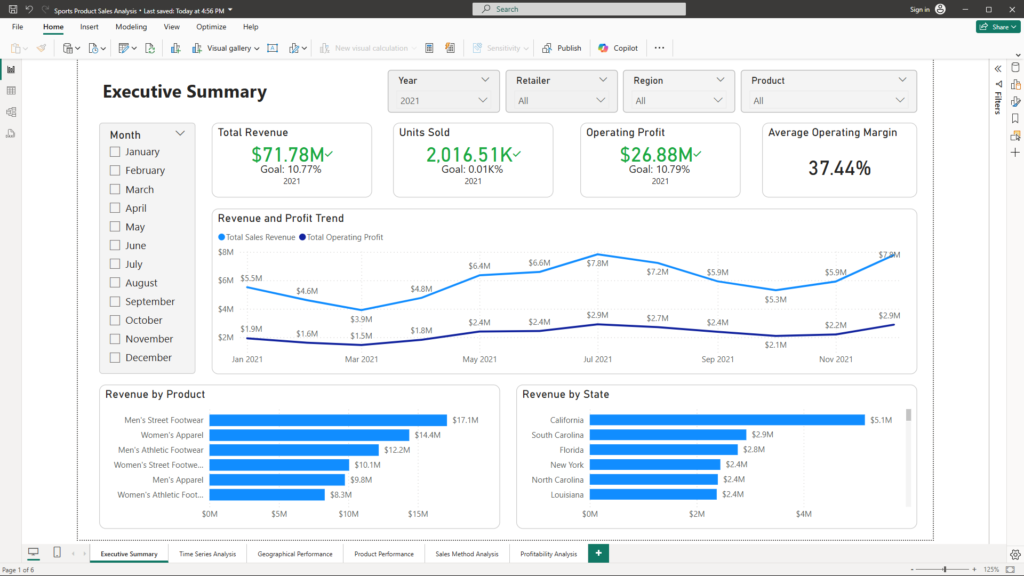
Visuals and Business Advantages:
- KPIs (Card/KPI Visuals):
- Titles: “Total Revenue 2021”, “Units Sold 2021”, “Operating Profit 2021”, “Average Operating Margin 2021”
- Advantage: Immediate visibility into critical metrics enables executives to assess overall performance at a glance.
- Revenue & Profit Trend (Line Chart):
- Title: “Revenue and Profit Trend (2021)”
- Advantage: Illustrates historical trends, helping stakeholders identify seasonal variations and long-term growth patterns.
- Revenue by Product (Bar Chart):
- Title: “Revenue by Product”
- Advantage: Highlights top-performing products, guiding inventory and marketing focus.
- Revenue by State (Bar Chart):
- Title: “Revenue by State”
- Advantage: Provides a regional breakdown, revealing geographic strengths and areas for improvement.
- Slicers:
- Filters: Month, Year, Retailer, Region, Product
- Advantage: Enhances interactivity, allowing for targeted drilling down into the data.
2. Time Series Analysis
Overview:
Time Series Analysis focuses on temporal trends to uncover patterns in sales, units sold, and operating profit. This report is essential for identifying both short-term fluctuations and long-term trends, smoothing out daily volatility to reveal the underlying performance trajectory.
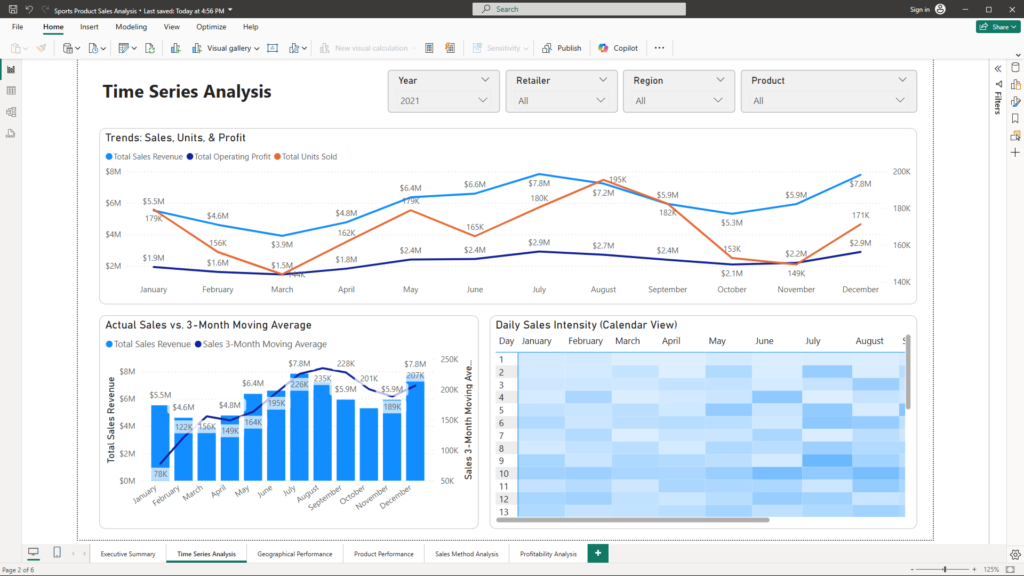
Visuals and Business Advantages:
- Trends (Line Chart):
- Title: “Monthly Trends: Sales, Units, & Profit”
- Advantage: Early detection of trends enables proactive adjustments to strategy and operations.
- Actual Sales vs. 3-Month Moving Average (Combo Chart):
- Title: “Actual Sales vs. 3-Month Moving Average”
- Advantage: Smoothing volatility highlights the true performance trend, supporting more accurate forecasting.
- Daily Sales Intensity (Heat Map Alternative):
- Title: “Daily Sales Intensity”
- Advantage: Reveals peak activity days and lulls, aiding in operational planning and promotional timing.
3. Geographical Performance
Overview:
Geographical Performance analysis breaks down sales data by location to pinpoint regional variations. This report helps identify local market strengths, revealing opportunities for tailored marketing and operational improvements.
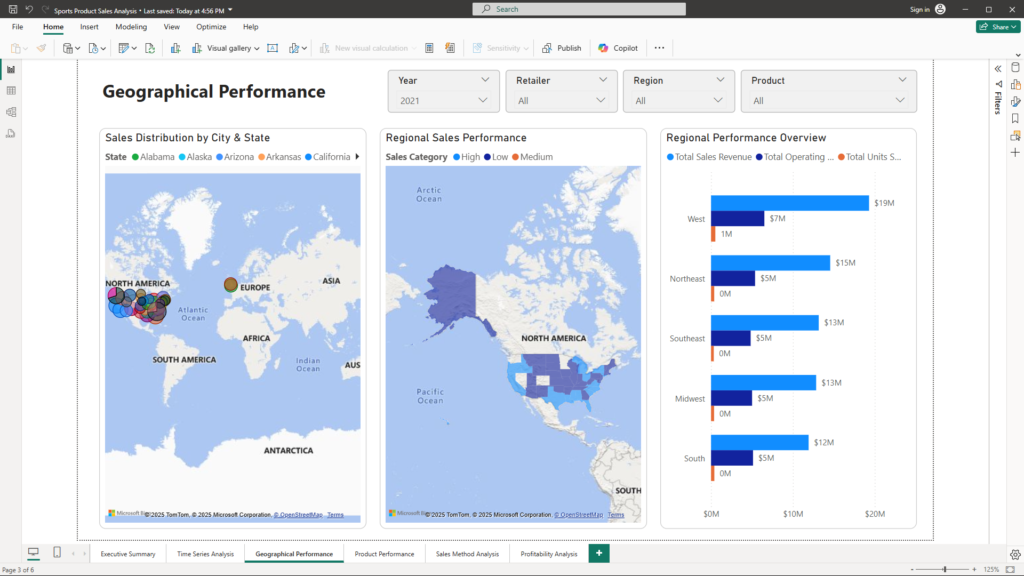
Visuals and Business Advantages:
- Sales Distribution by City & State (Map):
- Title: “Sales Distribution by City & State”
- Advantage: Pinpoints specific high-performing locales, driving targeted local marketing initiatives.
- Regional Sales Performance (Filled Map):
- Title: “Regional Sales Performance”
- Advantage: Offers a visual overview of performance differences across regions, guiding strategic regional investments.
- Regional Performance Overview (Clustered Bar Chart):
- Title: “Regional Performance Overview”
- Advantage: Direct comparisons between regions highlight operational strengths and areas for improvement.
4. Product Performance
Overview:
Product Performance analysis dives into individual product contributions and segmentation. It provides insights into which product lines are driving revenue and profit, supporting focused product management and promotional strategies.
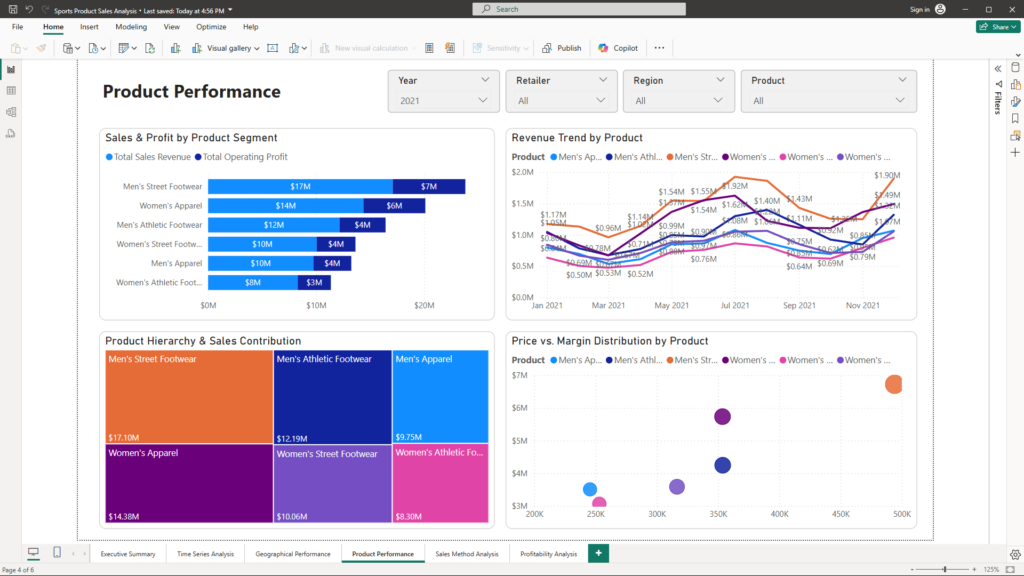
Visuals and Business Advantages:
- Sales & Profit by Product Segment (Stacked Bar Chart):
- Title: “Sales & Profit by Product Segment”
- Advantage: Reveals performance differences between product segments, aiding strategic prioritization.
- Revenue Trend by Product (Line Chart):
- Title: “Revenue Trend by Product”
- Advantage: Tracks product performance over time, identifying growth opportunities and underperformers.
- Product Hierarchy & Sales Contribution (Treemap):
- Title: “Product Hierarchy & Sales Contribution”
- Advantage: Offers an intuitive, hierarchical view of product contributions, highlighting key revenue drivers.
- Price vs. Margin Distribution by Product (Scatter Plot):
- Title: “Price vs. Margin Distribution by Product”
- Advantage: Uncovers the relationship between pricing and profitability, supporting informed pricing strategies.
5. Sales Method Analysis
Overview:
Sales Method Analysis evaluates the effectiveness of different sales channels. This report provides insights into how various methods contribute to overall performance, facilitating informed decisions regarding channel investments and strategy adjustments.
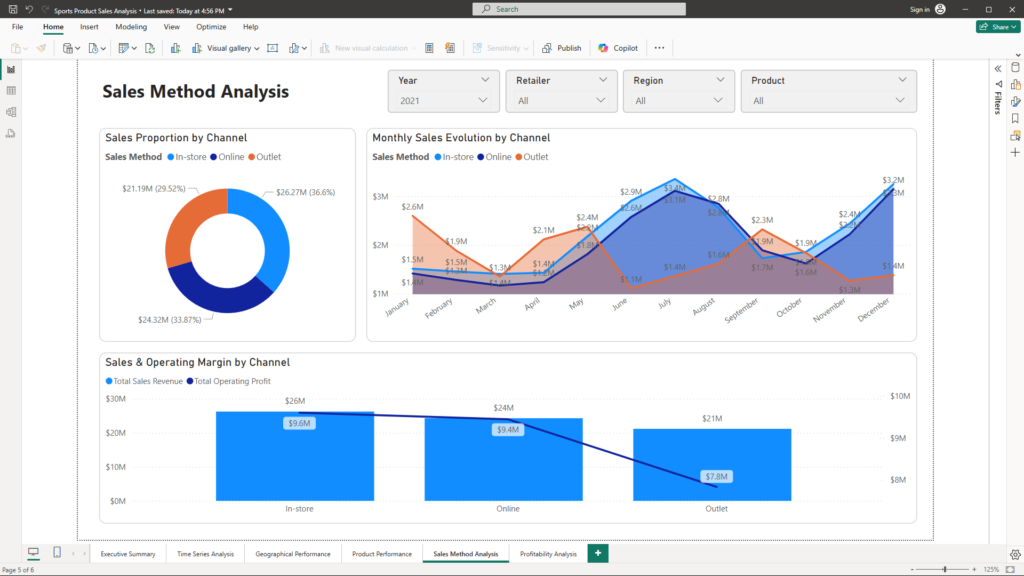
Visuals and Business Advantages:
- Sales Proportion by Channel (Donut Chart):
- Title: “Sales Proportion by Channel (2021)”
- Advantage: Clearly displays each channel’s contribution, guiding resource allocation and channel strategy.
- Monthly Sales Evolution by Channel (Area Chart):
- Title: “Monthly Sales Evolution by Channel”
- Advantage: Illustrates trends over time, highlighting shifts in channel effectiveness.
- Sales & Operating Margin by Channel (Combo Chart):
- Title: “Sales & Operating Margin by Channel”
- Advantage: Provides a dual view of sales performance and profitability across channels, enabling a deeper analysis of channel efficiency.
6. Profitability Analysis
Overview:
Profitability Analysis delves into the factors that drive profit. By linking sales volume with operating margins, this report uncovers which products and regions yield the highest profitability and where improvements can be made.
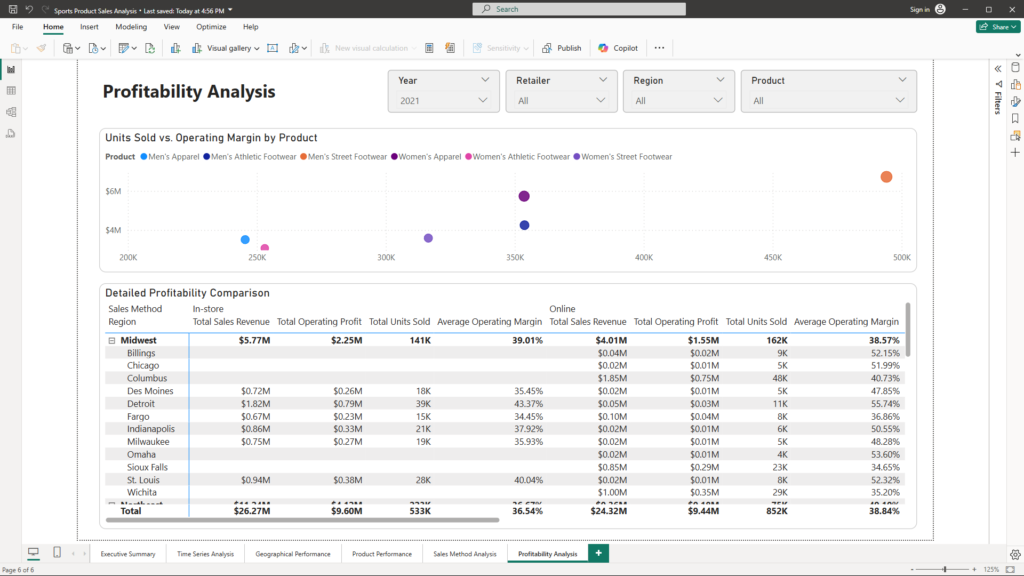
Visuals and Business Advantages:
- Units Sold vs. Operating Margin by Product (Scatter Plot):
- Title: “Units Sold vs. Operating Margin by Product”
- Advantage: Reveals the correlation between sales volume and profitability, highlighting products that benefit most from increased sales.
- Detailed Profitability Comparison (Matrix):
- Title: “Profitability Details by Product/Region”
- Advantage: Provides a granular, side-by-side view of multiple KPIs, supporting comprehensive performance comparisons and informed decision-making.
Conclusion
A robust product sales analysis framework transforms complex data into clear, actionable insights. With reports that provide an Executive Summary of key metrics, time series analyses for trend detection, geographical performance to guide regional strategies, product segmentation insights for targeted management, sales channel evaluations for optimized resource allocation, and detailed profitability breakdowns for strategic pricing and cost control, businesses are well-equipped to address challenges and capitalize on opportunities.
Integrating these reports into a cohesive dashboard enables decision-makers to swiftly navigate through data layers and make informed, strategic choices that drive growth and enhance competitive positioning. For further discussion or consultation on optimizing your product sales analysis, please feel free to reach out at mail@ssghosal.com.