Introduction
In today’s competitive business landscape, effective management of Accounts Receivable (AR) is critical for maintaining healthy cash flow and minimizing bad debt. In this case study, we demonstrate how a comprehensive suite of Power BI reports provided actionable insights that empowered senior management to drive operational improvements and make informed strategic decisions. This example not only highlights the business outcomes achieved but also showcases the value of data visualization in transforming raw data into meaningful business intelligence.
Problem Statement
Many organizations face challenges such as delayed payments, unresolved disputes, and unidentified cash flow risks. These issues can erode liquidity and increase operational costs, ultimately impacting customer satisfaction. Our challenge was to develop an integrated reporting solution that would:
- Highlight key financial metrics: Total invoiced amounts, average payment periods, and the proportion of overdue or disputed invoices.
- Analyze aging trends: Identify which segments of receivables are most problematic.
- Segment performance geographically and by customer: Spot high-risk regions and customers.
- Evaluate payment disputes: Understand how disputes affect cash flow.
- Forecast future trends: Provide a forward-looking view to help anticipate cash flow issues and bad debt risk.
The Power BI Solution
We designed a series of interactive dashboards in Power BI to address every facet of the AR process. By transforming raw data into visually engaging reports, our solution empowered management with real-time insights and predictive analytics. Below, we detail each report and the business value it delivered.
Report 1: Executive Overview
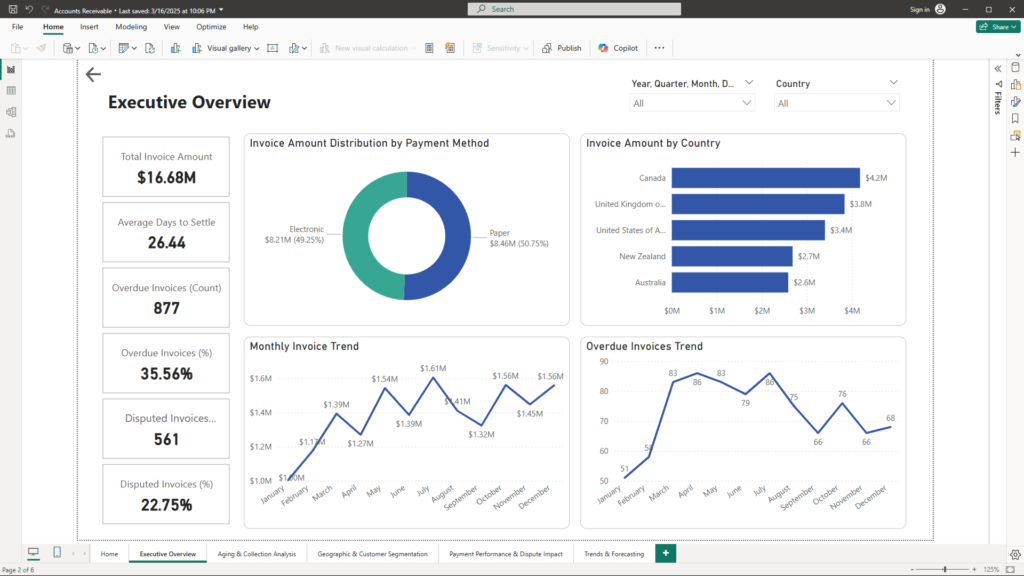
Purpose:
Provide a high-level snapshot of AR performance to help executives quickly assess the overall financial health and operational efficiency.
Key Visualizations:
- KPI Cards:
- Total Invoice Amount: A summary of all invoiced revenue.
- Average Days to Settle: The average time taken for invoice payments.
- Overdue & Disputed Invoices: The count and percentage of invoices that are overdue or under dispute.
- Donut Chart – “Invoice Amount Distribution by Payment Method”:
Breaks down invoicing by payment method (Paper vs. Electronic), highlighting trends in customer payment behavior. - Bar Chart – “Invoice Amount by Country”:
Aggregates invoice amounts by country, spotlighting regions with higher outstanding debts for targeted collection strategies.
Business Impact:
This overview provides senior leadership immediate visibility into key AR metrics, enabling swift decision-making and strategic planning.
Report 2: Aging & Collection Analysis
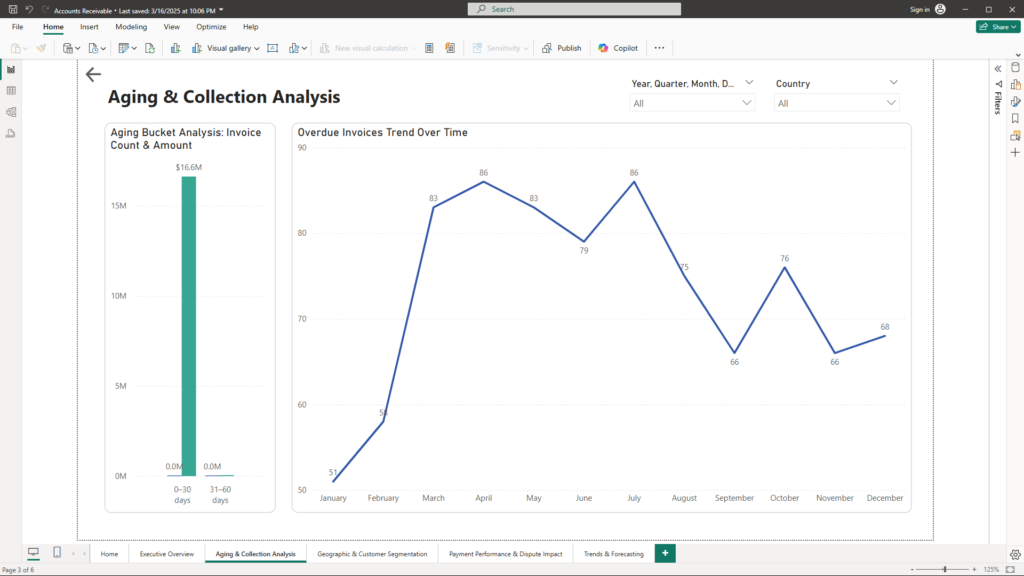
Purpose:
Drill down into the aging of receivables by segmenting invoices into aging buckets (0–30, 31–60, 61–90, >90 days), thereby pinpointing collection bottlenecks.
Key Visualizations:
- Stacked Bar Chart/Histogram – “Aging Bucket Analysis: Invoice Count & Amount”:
Visualizes the distribution of invoices across aging buckets, revealing segments with the highest risk. - Trend Line Chart – “Overdue Invoices Trend Over Time”:
Tracks overdue invoices monthly or quarterly, exposing seasonal trends or periods of deteriorating collection performance.
Business Impact:
By identifying the aging buckets that pose the greatest risk, management can focus on improving collection processes and reducing bad debt.
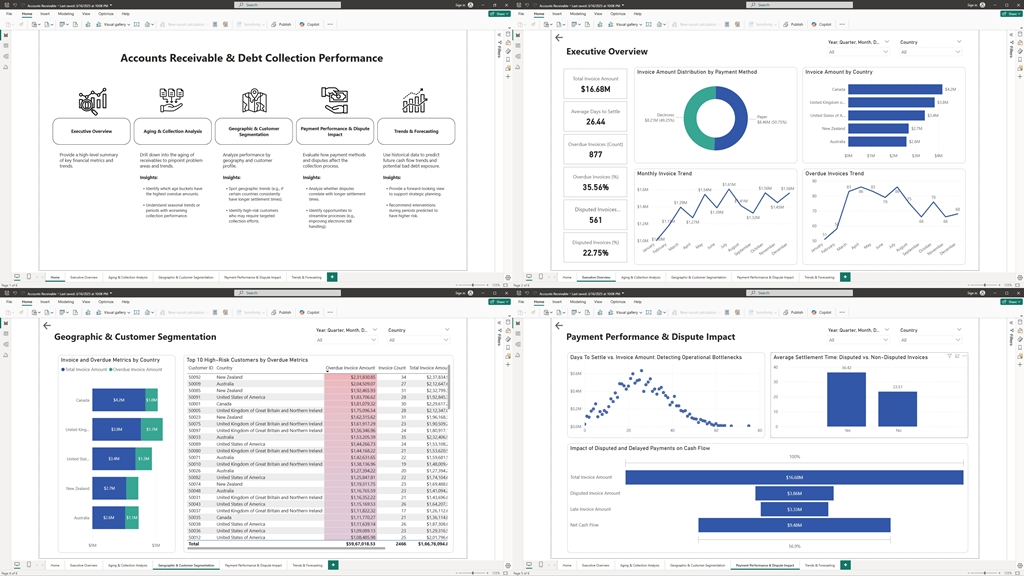
Report 3: Geographic & Customer Segmentation
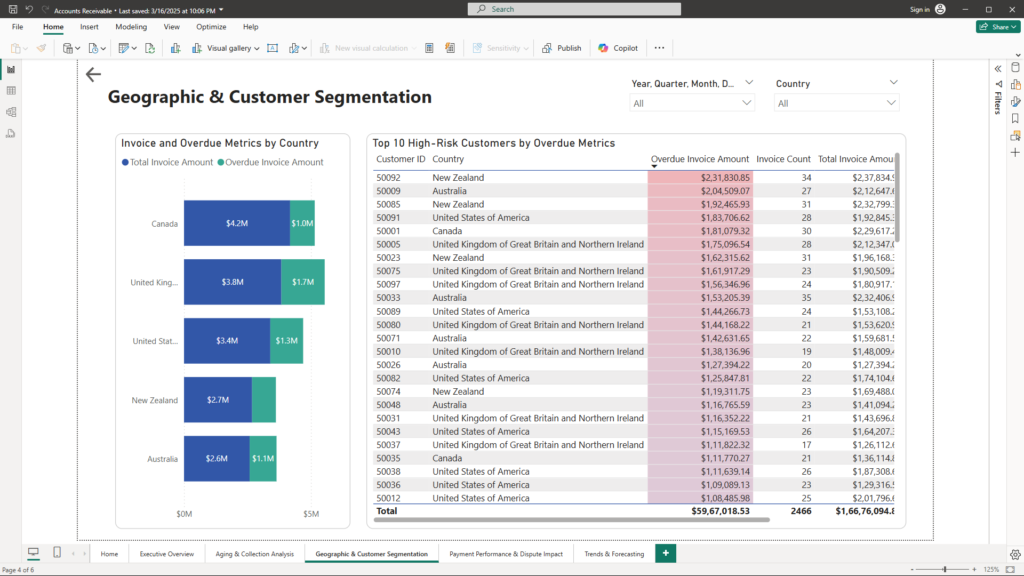
Purpose:
Provide a granular view of AR performance by geography and customer profile to identify high-risk regions and customer segments.
Key Visualizations:
- Map Visualization – “Invoice and Overdue Metrics by Country”:
Displays invoice amounts and overdue metrics on a map, making geographic trends immediately visible. - Customer Ranking Table – “Top 10 High-Risk Customers by Overdue Metrics”:
Ranks customers based on overdue amounts or days late, with drill-through capabilities for detailed profiles and targeted intervention strategies.
Business Impact:
This segmentation enables targeted collection efforts by ensuring that high-risk customers or regions receive prompt attention.
Report 4: Payment Performance & Dispute Impact
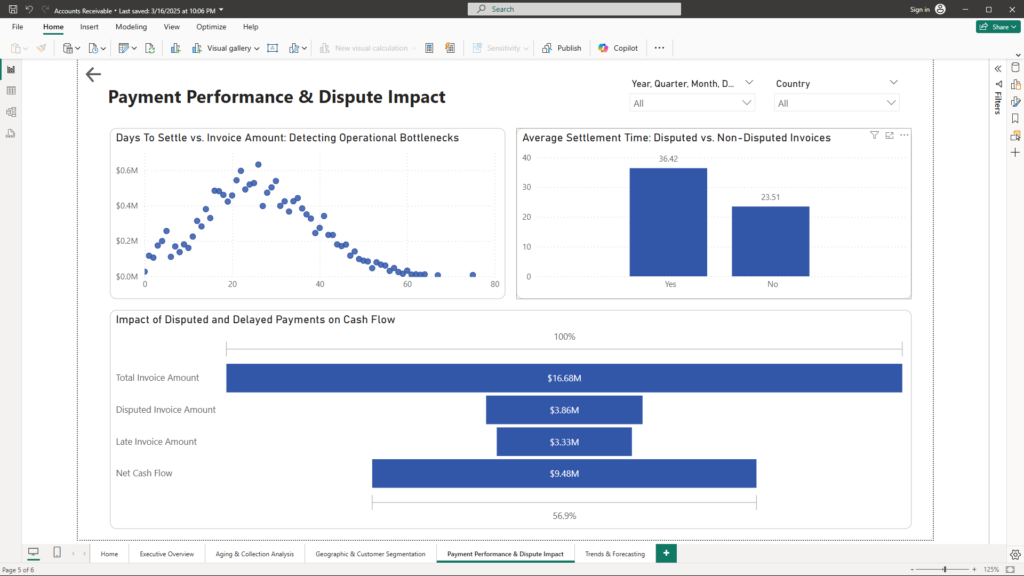
Purpose:
Evaluate the impact of payment methods and disputes on cash flow to understand operational inefficiencies.
Key Visualizations:
- Scatter Plot – “Days To Settle vs. Invoice Amount: Detecting Operational Bottlenecks”:
Identifies clusters and outliers where longer settlement times correlate with higher invoice amounts. - Bar/Column Chart – “Average Settlement Time: Disputed vs. Non-Disputed Invoices”:
Compares average settlement times to show if disputed invoices are causing delays. - Waterfall Chart – “Impact of Disputed and Delayed Payments on Cash Flow”:
Illustrates how disputed and late payments reduce the overall cash flow, highlighting areas for process improvement.
Business Impact:
These insights help management pinpoint operational bottlenecks and implement strategies—such as streamlining electronic billing or revising dispute resolution protocols—to improve cash flow.
Report 5: Trends & Forecasting
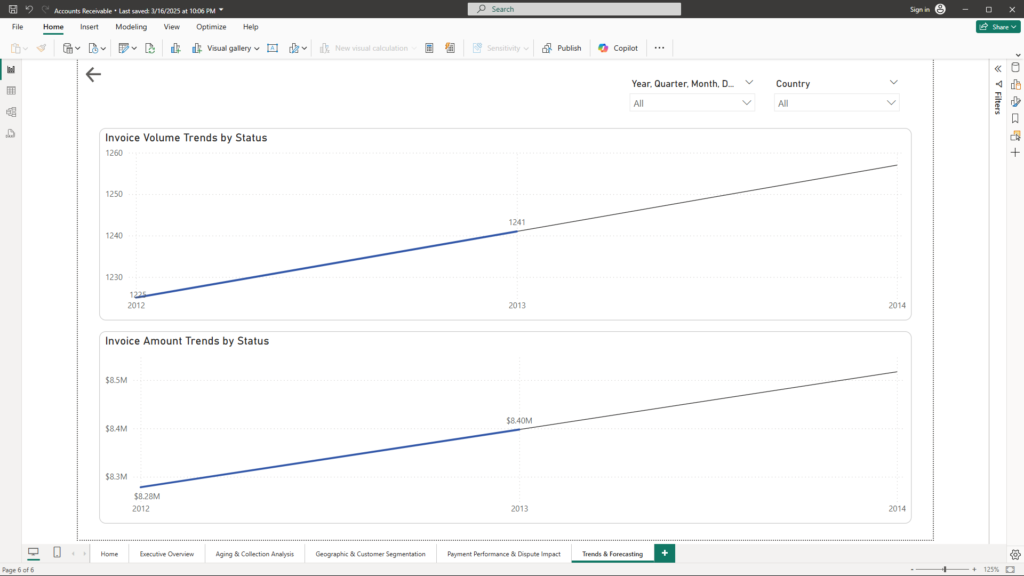
Purpose:
Use historical data to forecast future cash flow trends and potential bad debt exposure, supporting proactive strategic planning.
Key Visualizations:
- Line Chart – “Invoice Volume Trends by Status”:
Shows trends in the number of invoices over time, segmented by status (Settled, Overdue, Disputed). Forecasting capabilities extend these trends into future periods. - Line Chart – “Invoice Amount Trends by Status”:
Illustrates trends in invoice amounts, also segmented by status, and uses forecasting models to predict future cash inflows and risk areas.
Business Impact:
Forecasting allows management to anticipate high-risk periods, adjust credit policies, and allocate resources effectively to mitigate potential bad debt.
Interactivity: Deepening Insights with Dynamic Exploration
A key strength of our Power BI solution is its interactivity. With built-in slicers and drill-through capabilities, management can explore the data at multiple levels:
- Slicers:
Enable dynamic filtering by time periods, geographic regions, customer segments, or invoice status. This interactivity allows executives to quickly narrow down to the specifics that matter most to their immediate concerns. - Drill-Through Functionality:
Provides the ability to click on any high-risk customer or region to access detailed views, such as historical payment behavior, dispute resolution patterns, and cash flow trends. This granular access ensures that decisions are supported by deep, context-rich insights. - Interactive Dashboards:
The interconnected dashboards allow for seamless navigation between high-level summaries and detailed analyses. This intuitive design ensures that management not only gets a clear overview of AR performance but can also dive deep into specific issues to plan corrective actions.
Business Impact:
Interactivity transforms static reports into dynamic decision-support tools. By empowering management with the ability to explore data in real time, it becomes easier to identify emerging trends, verify assumptions, and implement targeted strategies that drive better financial outcomes.
Conclusion
Our Power BI solution has transformed the Accounts Receivable process by turning complex data into clear, actionable insights. Each report—from the Executive Overview to Trends & Forecasting—plays a crucial role in enabling management to:
- Reduce Bad Debt:
By focusing on problematic aging buckets and high-risk customers. - Improve Cash Flow:
Through targeted collection efforts and streamlined dispute resolution. - Plan Strategically:
With predictive analytics that forecast future risks and inform proactive decision-making.
If you’re interested in learning how these insights can drive real change in your organization or if you need a tailored solution for your AR challenges, feel free to reach out. I’m always excited to help businesses unlock the power of data for strategic financial management.
Contact: mail@ssghosal.com