Introduction
In today’s competitive hospitality industry, hotel executives must rely on real-time, actionable insights to optimize operations, maximize revenue, and enhance guest satisfaction. The Fauget Hotel Data Analysis Dashboard is a comprehensive Power BI solution designed to address these challenges by transforming raw reservation data into an interactive, visually compelling reporting suite. Although this project was built using fabricated data to ensure client data privacy, it closely mirrors real-world scenarios and operational challenges faced by leading hotels.
Problem Statement
Hotel management frequently encounters several critical challenges:
- Inefficient Reservation Monitoring: Difficulty in tracking booking volumes, cancellation trends, and revenue performance in real time.
- Operational Inefficiencies: A lack of clear insights into booking patterns, guest demographics, and the impact of special service requests can lead to missed opportunities in revenue optimization.
- Segmented Guest Behavior: The inability to differentiate between repeat and first-time guest behavior hampers effective marketing and loyalty programs.
- Fragmented Data Analysis: Disparate data sources and manual reporting processes hinder proactive decision-making.
These challenges necessitated a unified dashboard that consolidates key performance indicators (KPIs) and enables granular analysis across various dimensions such as time, market segments, room types, and guest behavior.
The Power BI Solution
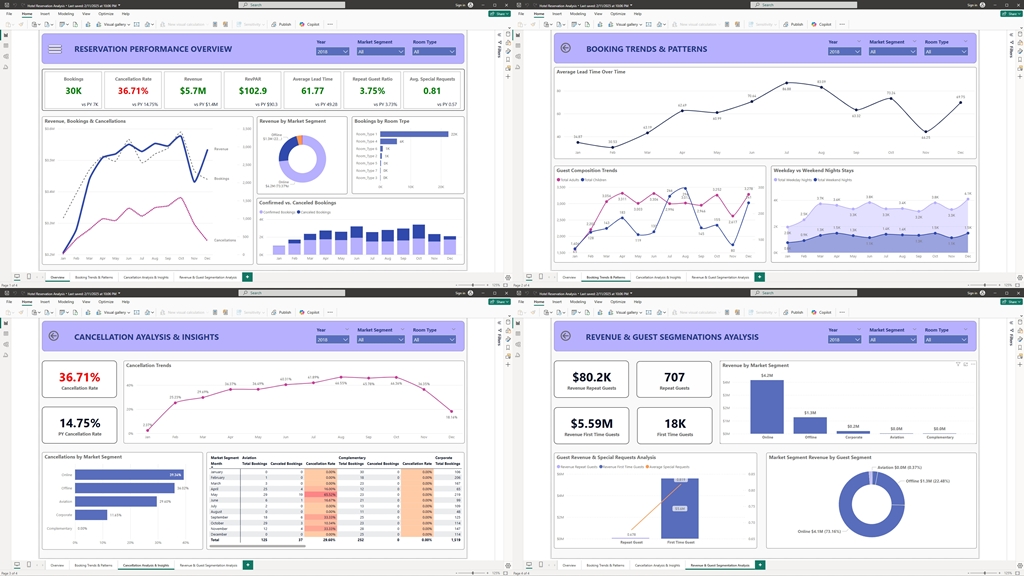
Leveraging the robust capabilities of Power BI, the Fauget Hotel Dashboard was designed as a multi-page solution that addresses the outlined challenges. The dashboard is organized into four distinct pages:
Report 1: Reservation Performance Overview
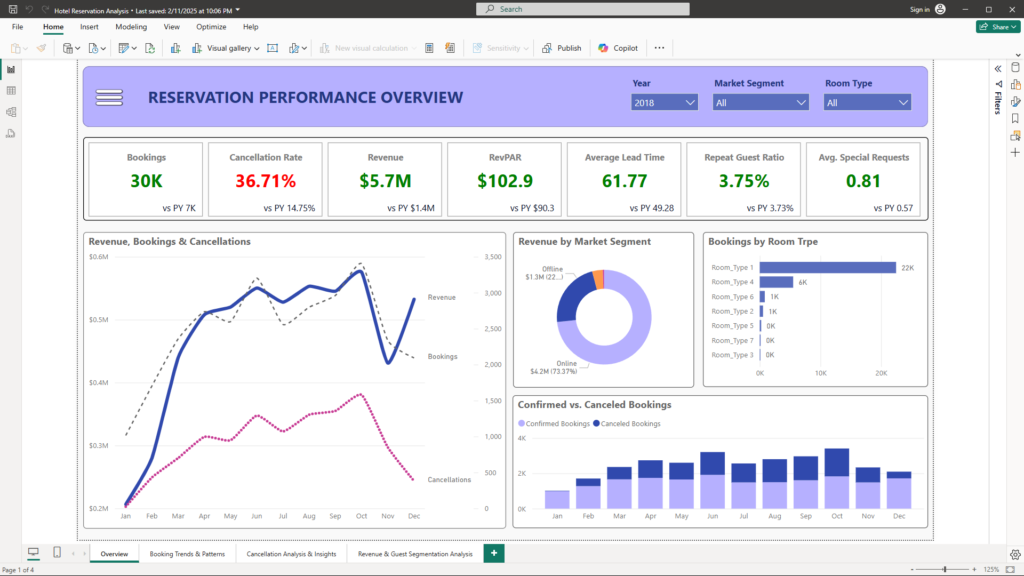
This page provides a high-level snapshot of overall hotel performance using seven critical KPIs:
- Total Bookings
- Cancellation Rate
- Total Revenue
- RevPAR (Revenue per Booked Night)
- Average Lead Time
- Repeat Guest Ratio
- Average Special Requests
Each KPI is presented alongside a previous-year (PY) comparison, allowing management to assess performance trends over time. Complementary visuals include:
- A combined chart showing Total Revenue, Total Bookings, and Canceled Bookings over time.
- A donut chart detailing Revenue by Market Segment.
- A bar chart for Bookings by Room Type.
- A column chart comparing Confirmed vs. Canceled Bookings.
Business Benefits:
- Quick Snapshot of Overall Performance: The consolidated KPIs offer an at-a-glance view of the hotel’s operational health.
- Trend Analysis: Year-over-year comparisons help in identifying seasonal trends, areas of growth, and potential concerns early on.
- Strategic Insights: Visualizations enable executives to understand revenue distribution and booking behaviors, facilitating more informed strategic decisions.
Report 2: Booking Trends & Patterns
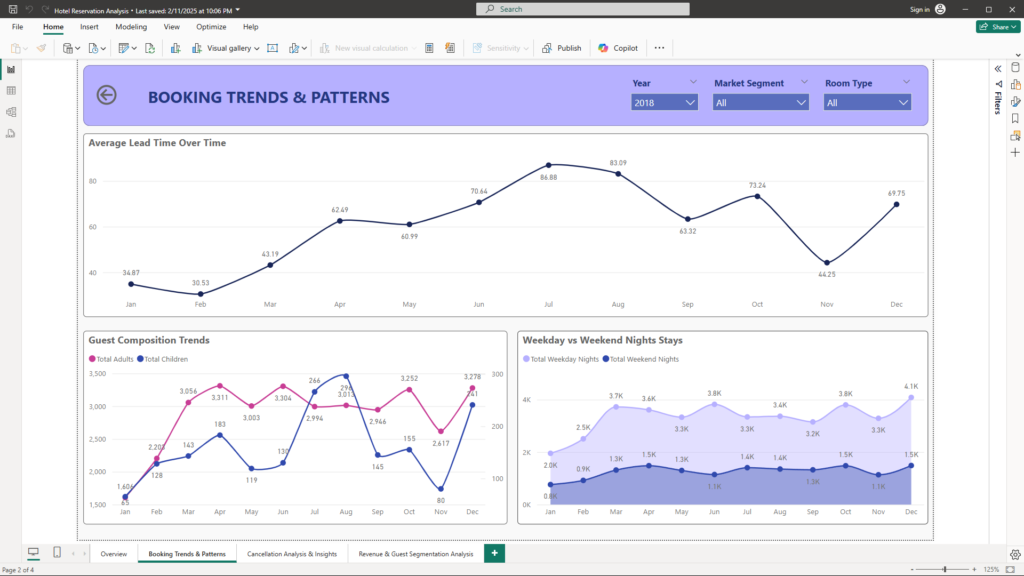
Understanding guest booking behavior is crucial for optimizing both operational planning and marketing strategies. This page highlights key trends, including:
- Average Lead Time Over Time: A line chart that illustrates how far in advance guests are booking their stays.
- Guest Composition Trends: A chart that breaks down booking demographics (adults vs. children) to reveal underlying trends.
- Weekday vs. Weekend Nights Stays: An area chart that visualizes the distribution of bookings between weekdays and weekends.
Business Benefits:
- Operational Efficiency: By understanding lead time trends, the hotel can better manage staffing, inventory, and pricing strategies.
- Targeted Marketing: Insights into guest composition support more personalized marketing efforts and guest experience improvements.
- Resource Optimization: Knowledge of weekday versus weekend booking patterns helps in planning promotions and resource allocation during peak periods.
Report 3: Cancellation Analysis & Insights
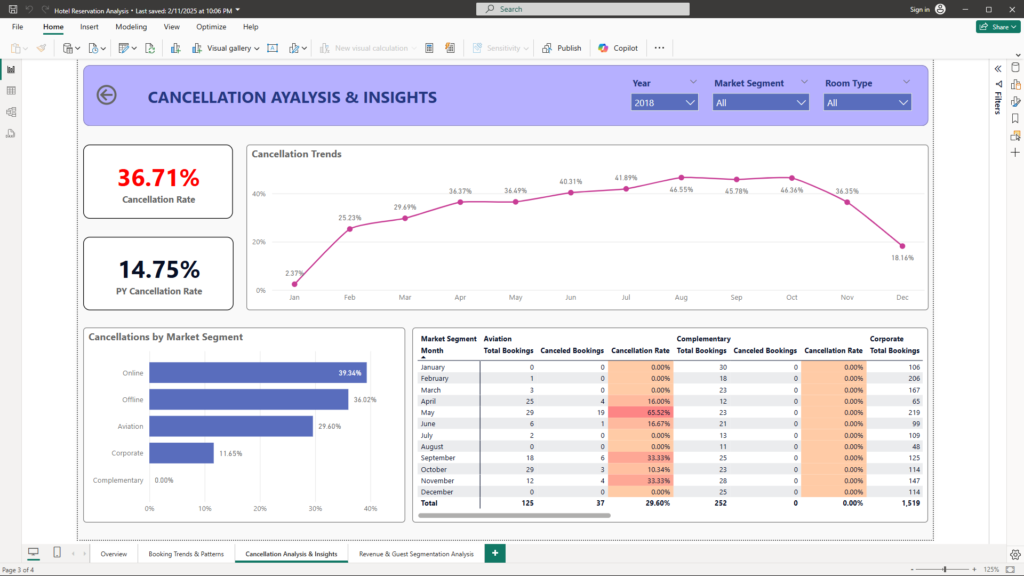
High cancellation rates can significantly impact revenue and operational efficiency. This page is dedicated to examining cancellation trends and potential causes through:
- Cancellation Rate & PY Cancellation Rate Charts: Offering a clear view of cancellation performance over time.
- Cancellation Trends Line Chart: Highlighting temporal patterns and identifying potential spikes in cancellations.
- Cancellations by Market Segment Bar Chart: Revealing which market segments are most prone to cancellations.
- Detailed Matrix: Providing a granular, monthly breakdown of cancellations by market segment for deeper investigation.
Business Benefits:
- Proactive Issue Identification: Timely analysis of cancellation trends allows management to quickly detect anomalies and address underlying causes.
- Improved Booking Reliability: Understanding the patterns behind cancellations helps in refining booking policies and customer engagement strategies.
- Cost Reduction: By reducing cancellation rates, the hotel can minimize revenue leakage and better forecast occupancy.
Report 4: Revenue & Guest Segmentation Analysis
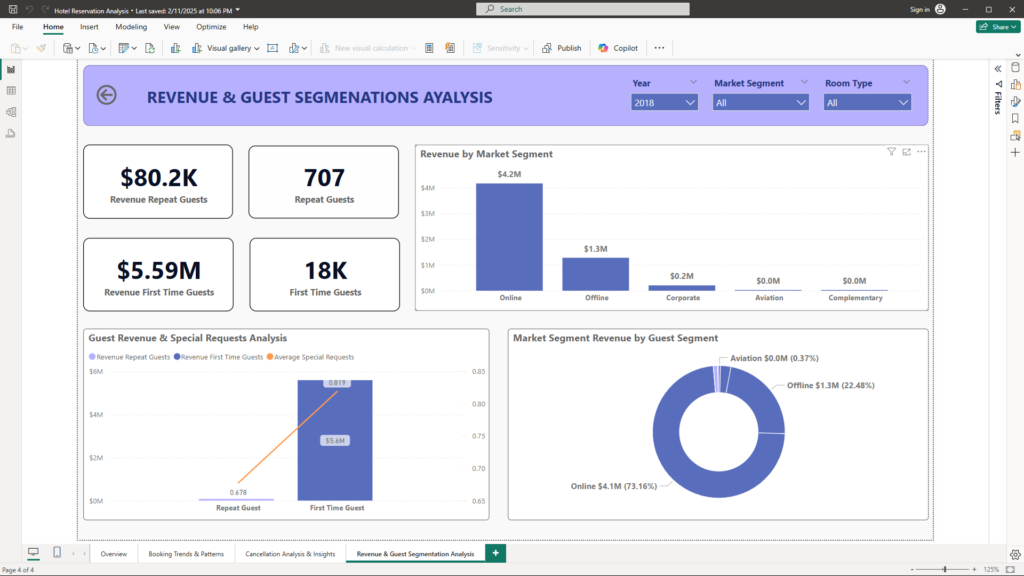
Focusing on revenue generation and guest behavior segmentation, this page drives targeted marketing and operational improvements. Key components include:
- Revenue Segmentation Cards: Displaying metrics for Revenue from Repeat Guests, Revenue from First-Time Guests, and counts of both guest types.
- Revenue by Segment Column Chart: Visualizing how revenue is distributed across different room types, meal plans, and market segments.
- Guest Revenue & Special Requests Analysis Bar Chart: Comparing guest segments to assess the impact of special requests on revenue.
- Market Segment Revenue by Guest Segment Donut Chart: Illustrating the proportional contribution of different guest types within various market segments.
Business Benefits:
- Revenue Optimization: Detailed segmentation uncovers which guest groups and service options are most profitable, driving targeted revenue strategies.
- Enhanced Guest Experience: Analyzing the impact of special requests helps in refining service offerings to boost customer satisfaction and loyalty.
- Strategic Marketing: Differentiating between repeat and first-time guests supports the development of tailored marketing initiatives and loyalty programs.
Interactive Filtering: Empowering Users with Real-Time Data Exploration
One of the key strengths of the Fauget Hotel Dashboard is its robust interactivity—designed to put the power of data exploration directly into the hands of its users. The dashboard is equipped with multiple filters and clickable visuals that transform static reports into dynamic, actionable insights. Here’s how interactive filtering elevates the user experience and drives business value:
1. Granular Control with Slicers
- Year, Market Segment, and Room Type Filters:
- Precision Analysis: Users can quickly narrow down the dataset by selecting specific years, market segments, or room types, enabling them to focus on precise areas of interest.
- Real-Time Impact: As filters are applied, every visual on the dashboard updates instantly. This synchronized update ensures a cohesive snapshot of the data across all components.
2. Interactive Visual Drill-Downs
- Clickable Chart Elements:
- Drill-Down Capabilities: Many visuals, such as time-series line charts and segmented bar charts, allow users to drill down into deeper layers of data—transitioning from high-level monthly trends to detailed daily insights.
- Enhanced Discovery: Direct interaction with the charts uncovers hidden patterns and correlations, providing invaluable insights into booking behavior and cancellation trends.
3. Seamless Cross-Filtering Across Visuals
- Synchronized Data Views:
- Unified Analysis: Selecting an element in one visual (e.g., a specific market segment in the donut chart) automatically filters the rest of the dashboard. This cross-filtering mechanism ensures that all components—ranging from KPI cards to detailed matrices—reflect the same filtered dataset.
- Efficient Insights: This interconnected filtering saves time and minimizes misinterpretation, as all insights are derived from a single, unified view of the data.
Positive Outcomes
The implementation of the Fauget Hotel Dashboard has delivered several notable benefits:
- Enhanced Operational Visibility: Real-time monitoring of key metrics enables swift decision-making and proactive operational adjustments.
- Data-Driven Strategy: Detailed segmentation of revenue and guest behavior informs targeted marketing campaigns and improved service offerings.
- Improved Forecasting: Analysis of booking trends and lead times supports better capacity planning and resource allocation.
- Actionable Insights: Comprehensive cancellation analysis helps identify root causes, reducing revenue leakage and improving booking reliability.
- User-Friendly Experience: Intuitive navigation, interactive filters, and drill-down capabilities ensure that stakeholders at every level can extract meaningful insights from the data.
Conclusion
The Fauget Hotel Data Analysis Dashboard is a testament to the power of data visualization and analytics in the hospitality industry. By consolidating critical performance metrics into an interactive, multi-faceted Power BI solution, this dashboard not only addresses key operational challenges but also paves the way for strategic decision-making and revenue optimization.
Built using imagined data that reflects real-world scenarios, this project demonstrates my proficiency in data analysis, dashboard design, and Power BI development. I look forward to leveraging these skills to drive actionable insights and tangible business outcomes for future clients.
Get in Touch
Are you looking to leverage data analytics to enhance your business performance? Let’s collaborate! Reach out to me at mail@ssghosal.com to discuss how we can build data-driven solutions that empower your organization.