Introduction
In today’s competitive market, data-driven decision-making is the key to sustainable growth. The Camera Sales Analysis dashboard is designed to provide top management with actionable insights into key business metrics, sales trends, customer behavior, regional performance, and profitability. By leveraging advanced data analytics, this dashboard helps in identifying growth opportunities, optimizing inventory, and refining pricing strategies.
This article presents a comprehensive breakdown of how the dashboard addresses key business challenges through five essential reports, offering a clear pathway to increased revenue and profitability.
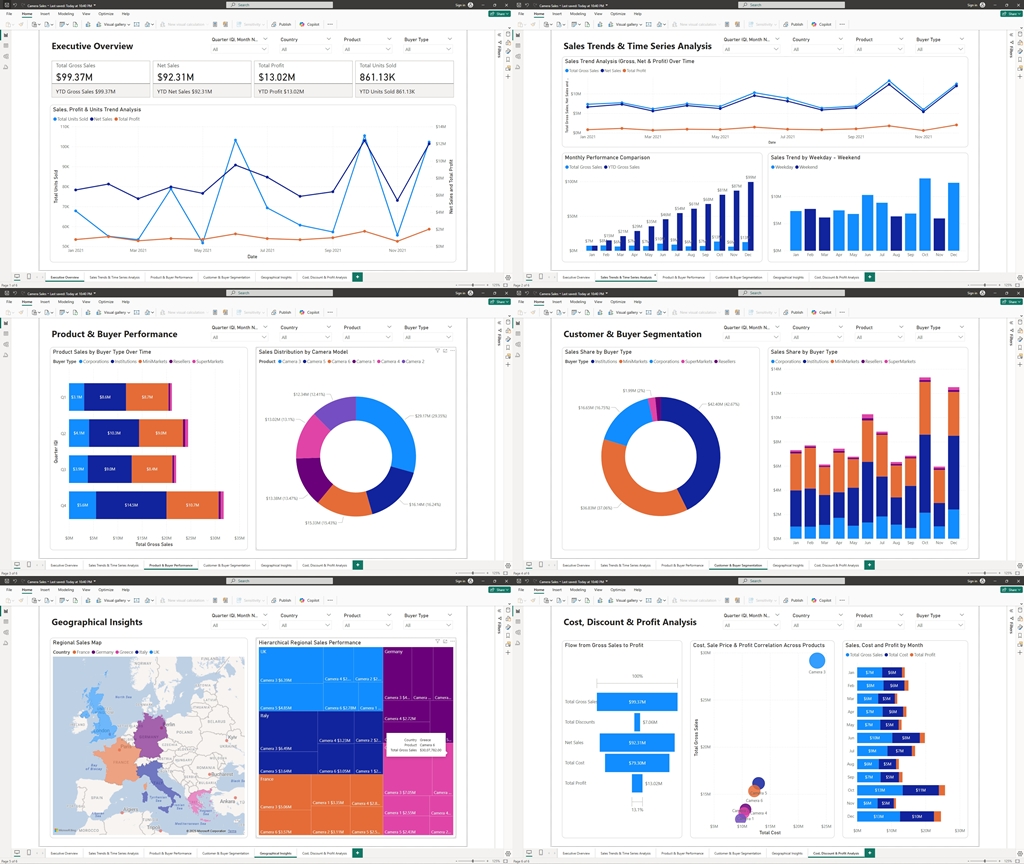
Executive Overview
Key Business Challenge:
Top executives require a quick and precise snapshot of business performance. Manual reporting is inefficient, and understanding high-level trends without real-time data can result in delayed decision-making.
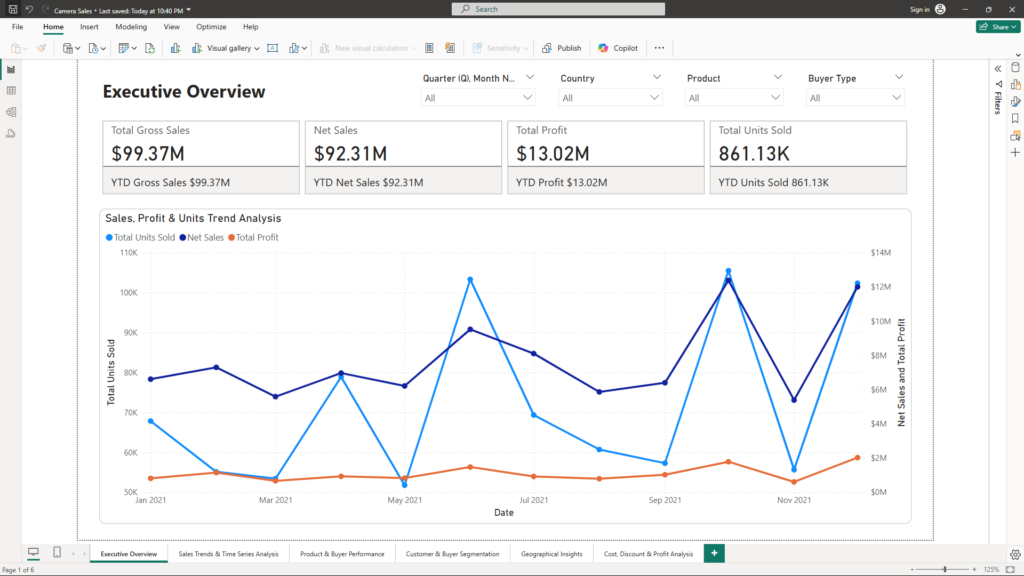
Solution:
The Executive Overview report provides a high-level summary using Key Performance Indicators (KPIs):
- Total Gross Sales – Represents overall revenue before discounts and returns, providing an insight into market demand.
- Net Sales – Revenue after discounts and returns, offering a realistic view of earnings.
- Total Profit – The actual earnings after deducting all costs, ensuring business sustainability.
- Total Units Sold – Helps in understanding volume-driven revenue growth.
Each KPI is supplemented by Year-to-Date (YTD) values, allowing management to compare current performance against historical data.
Additionally, a line chart presents sales, profit, and unit trends over time, enabling executives to spot seasonality, growth patterns, and sudden sales fluctuations.
Sales Trends & Time Series Analysis
Key Business Challenge:
Sales performance is dynamic and influenced by multiple factors such as seasonality, promotions, and economic conditions. Identifying these trends manually is cumbersome.
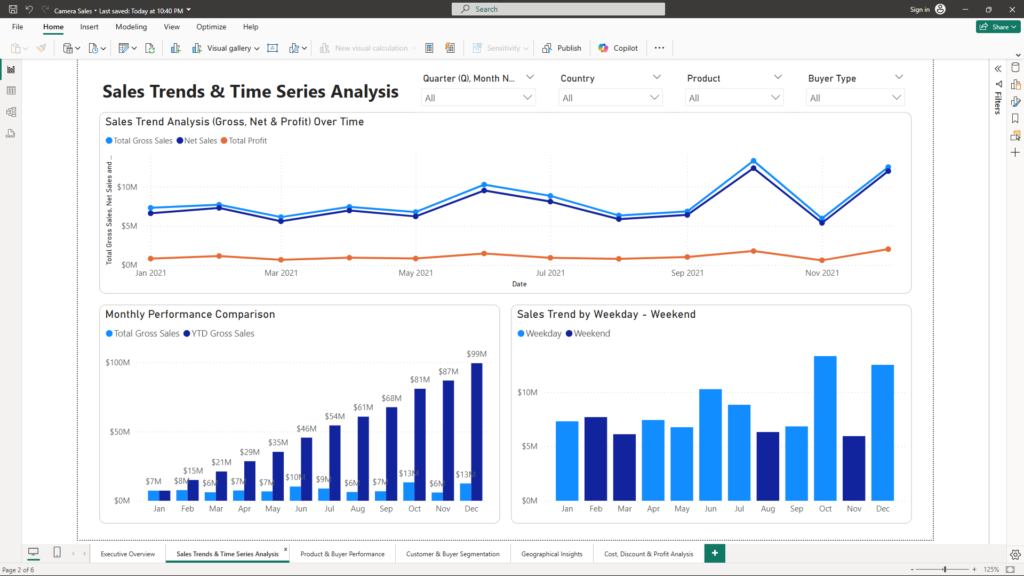
Solution:
This report provides a deep dive into sales trends with various time-based analyses:
- Sales Trend Analysis (Line Chart) – Tracks Gross Sales, Net Sales, and Profit over time, helping in spotting seasonal fluctuations and demand trends.
- Monthly Performance Comparison (Column Chart) – Compares monthly Gross Sales with YTD Gross Sales to monitor if business is on track to meet annual targets.
- Sales Trend by Weekday vs. Weekend (Column Chart) – Reveals whether sales vary across different days, aiding in scheduling promotions or optimizing staffing levels.
By utilizing a Calendar table, management can drill down into Year → Quarter → Month → Day insights, ensuring data-driven decision-making.
Product & Buyer Performance
Key Business Challenge:
Not all products and buyers contribute equally to revenue. Without a clear view of product performance and customer segmentation, inventory management and sales strategies can suffer.
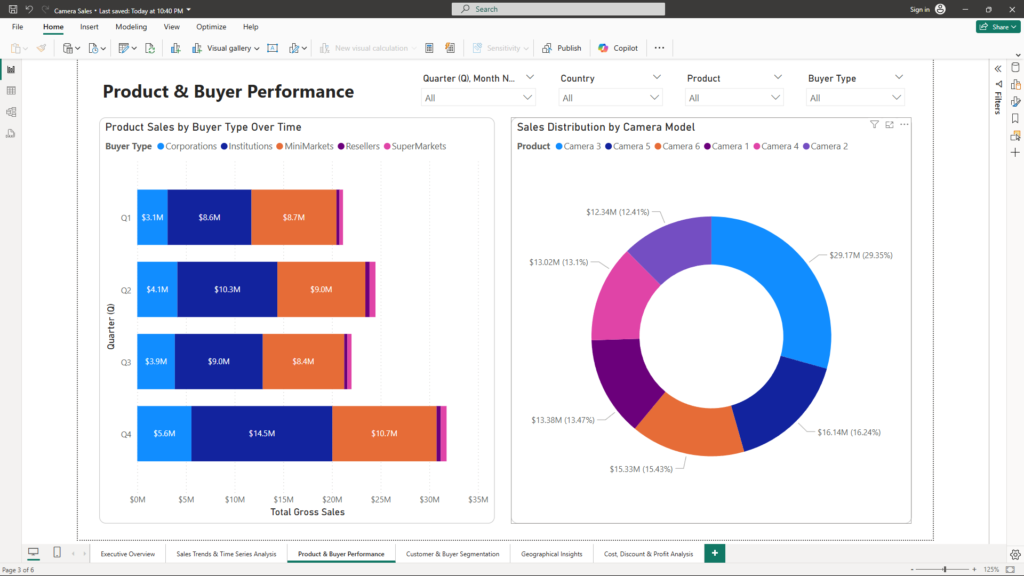
Solution:
This report highlights which products are driving revenue and how different buyer types contribute to sales:
- Product Sales by Buyer Type (Stacked Bar Chart) – Segments sales by buyer categories (Institutions, Resellers, Supermarkets) to understand revenue distribution.
- Sales Distribution by Camera Model (Donut Chart) – Identifies best-selling models and underperformers, enabling optimized inventory and targeted promotions.
Using time-based filtering from the Calendar table, management can analyze how product sales evolve over different periods, uncovering insights on seasonal demand shifts.
Customer & Buyer Segmentation
Key Business Challenge:
Customer behavior varies widely across different segments. Understanding who buys the most and when they buy is essential for marketing and pricing strategies.
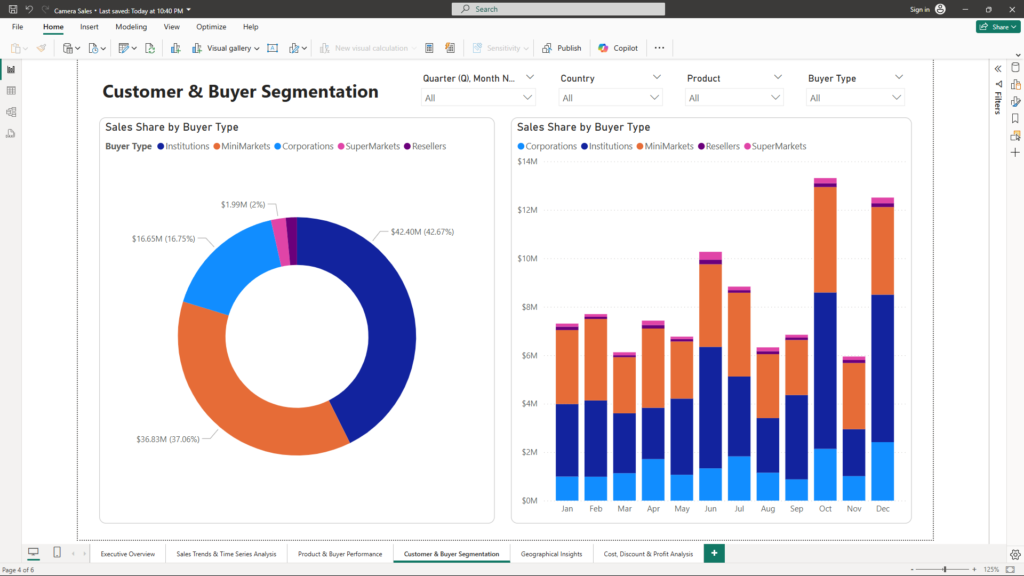
Solution:
This report provides a detailed breakdown of sales by buyer type using:
- Sales Share by Buyer Type (Donut Chart & Column Chart) – Helps in identifying the most valuable customer segments and their contribution to total sales.
- Customer Behavior Analysis (Time-Based Segmentation) – Using “Day Name” and “Weekday – Weekend” fields, this analysis uncovers behavioral patterns, such as institutions buying in bulk at the start of a fiscal quarter or resellers placing frequent orders.
These insights help in designing customer-centric pricing models and promotional strategies, ultimately driving higher engagement and sales.
Geographical Insights
Key Business Challenge:
Sales performance varies across regions. Identifying high-performing and underperforming regions can optimize resource allocation and marketing efforts.
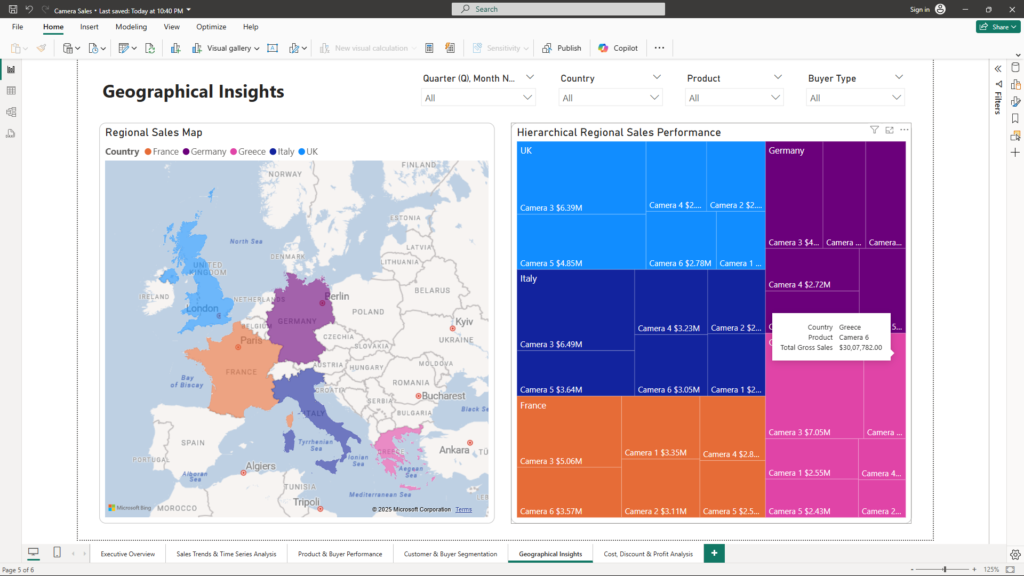
Solution:
The Geographical Insights report presents a regional breakdown of sales using:
- Regional Sales Map (Map & Filled Map) – Displays sales distribution by country and allows filtering for different time periods to uncover regional trends.
- Hierarchical Regional Sales Performance (Treemap) – Provides a granular view of sales by region, helping in identifying strong and weak markets.
By analyzing sales trends at a regional level, management can optimize supply chains, adjust regional marketing strategies, and identify new expansion opportunities.
Cost, Discount & Profit Analysis
Key Business Challenge:
Discounts, cost fluctuations, and pricing strategies significantly impact profit margins. Without clear visibility, it is difficult to optimize profitability.
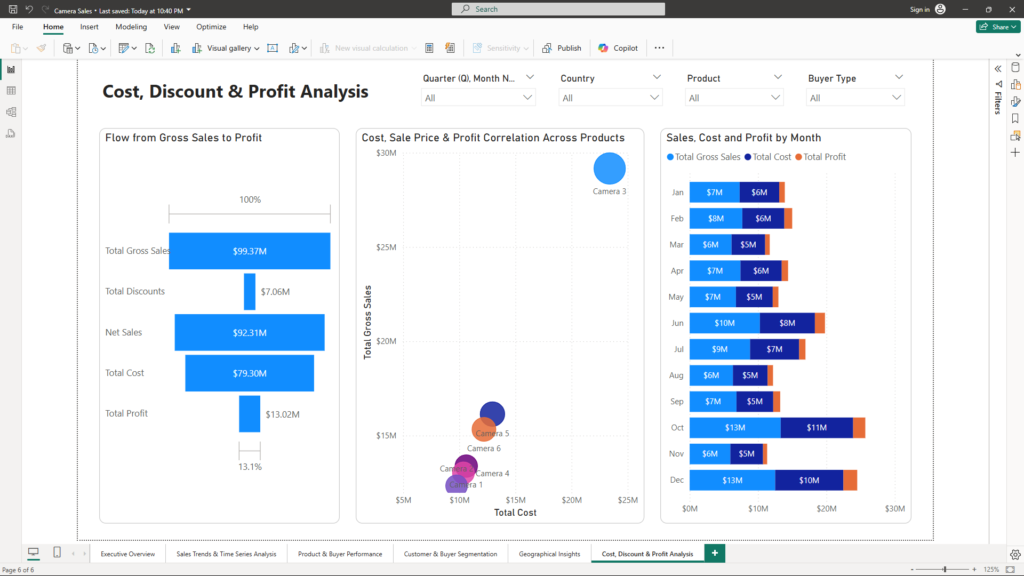
Solution:
This report provides a comprehensive breakdown of cost structures and profit margins using:
- Flow from Gross Sales to Profit (Waterfall Chart) – Clearly illustrates the financial impact of discounts, costs, and net earnings, allowing better discount policy adjustments.
- Cost, Sale Price & Profit Correlation (Scatter Plot) – Helps in identifying which products generate the highest profit margins relative to their cost, ensuring competitive and profitable pricing strategies.
- Sales, Cost & Profit by Month (Column Chart) – Tracks key financial metrics across months, uncovering periods with high discount impact or cost overruns.
By incorporating time-based filtering, the dashboard enables management to analyze cost efficiency over time, identify discount effectiveness, and optimize future pricing models.
Conclusion
This Camera Sales Analysis dashboard delivers powerful, data-driven insights that enable top management to make strategic business decisions with confidence. By leveraging advanced analytics and visual storytelling, the dashboard helps in:
- Monitoring business performance in real time.
- Understanding sales trends and seasonal patterns.
- Identifying high-value customer segments and regional opportunities.
- Optimizing product pricing, discount strategies, and profitability.
With this level of data visibility and precision, businesses can drive revenue growth, improve financial performance, and maintain a competitive edge in the market.
For further discussions or to explore how these insights can be tailored to your business needs, please contact mail@ssghosal.com.