In today’s competitive market, making informed decisions is essential for operational excellence. This case study showcases a supplier data analysis that transforms raw data into actionable insights to improve supplier performance and overall business quality.
A Holistic Approach to Supplier Analysis
A comprehensive data model was created by integrating multiple data sources into one cohesive framework. Supplier data was organized into intuitive dimensions—such as Vendor, Plant, Material, and Defect details—enabling a multidimensional analysis that quickly identifies problem areas and informs targeted improvements.
Key Areas of Analysis
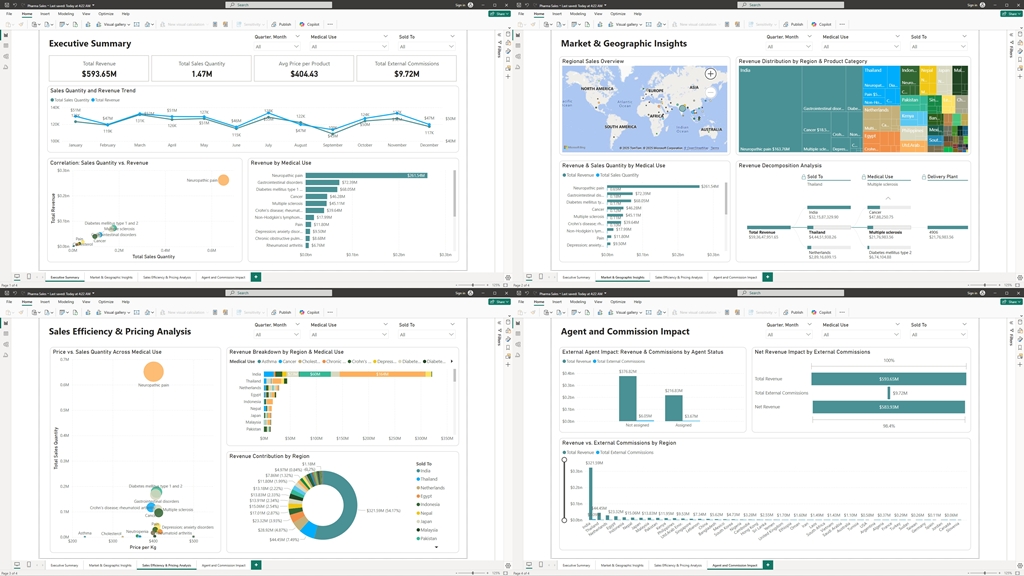
1. Executive Overview
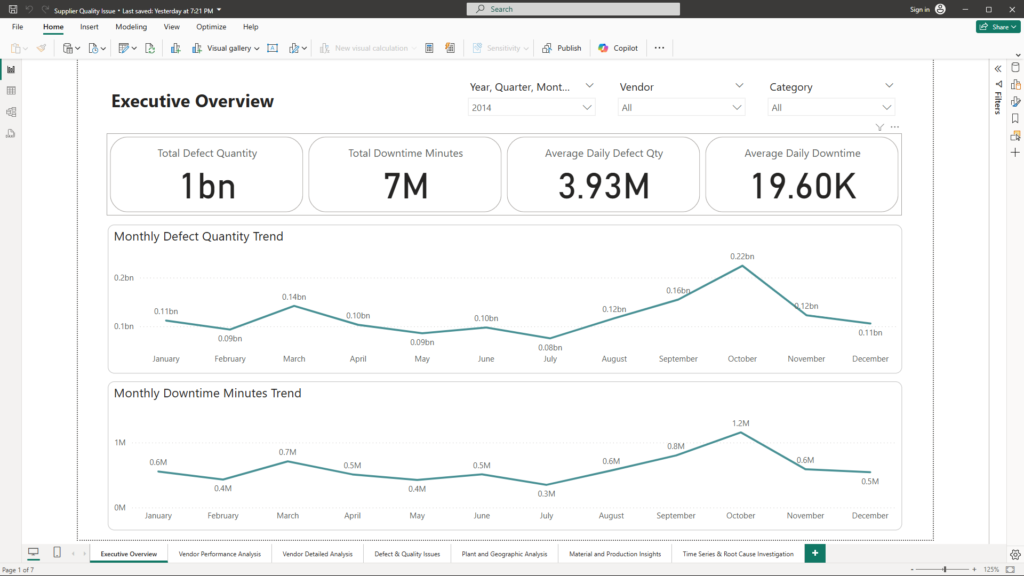
An executive dashboard was designed to provide a high-level snapshot of supplier performance, featuring:
- Clear Performance Indicators: Quick-read cards displaying overall defect quantities and downtime.
- Trend Visuals: Interactive charts that reveal how these metrics evolve over time.
- Interactive Filters: Slicers that allow stakeholders to filter data by date, vendor, and category for tailored insights.
Benefit for Clients: This snapshot enables leadership to monitor critical issues at a glance and make proactive decisions to maintain smooth operations.
2. Vendor Performance Analysis
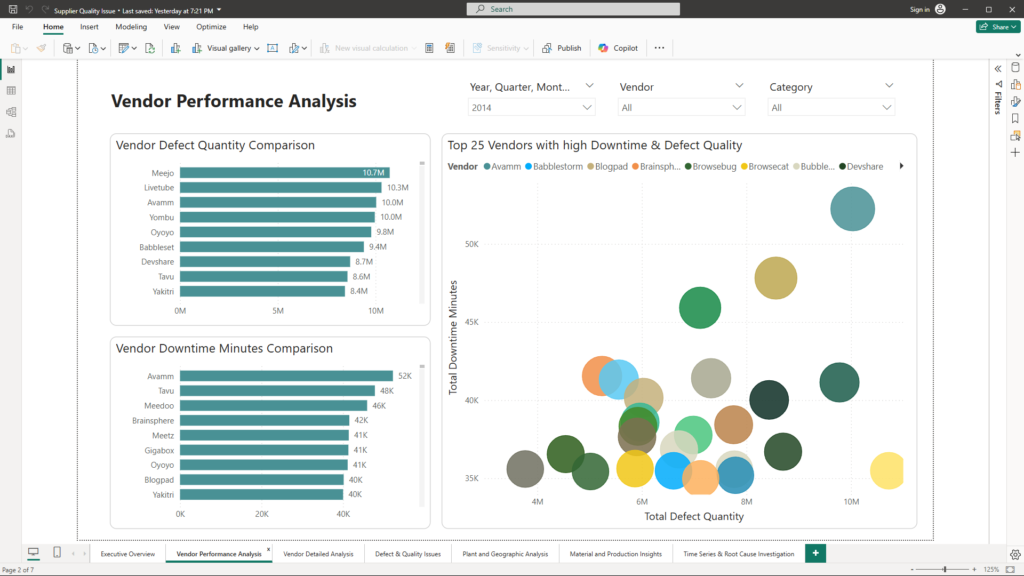
The vendor performance dashboard focuses on supplier-specific issues by:
- Ranking Suppliers: Visual comparisons identify vendors with higher defect quantities and downtime.
- Highlighting Outliers: Conditional formatting emphasizes suppliers that require further investigation.
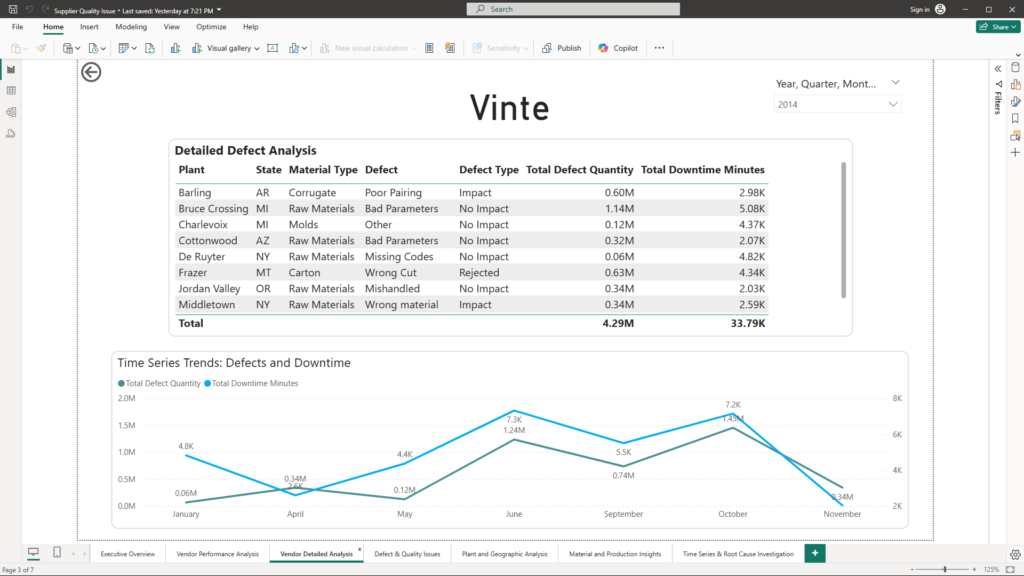
- Enabling Detailed Exploration: Interactive drill-through features allow for in-depth analysis of individual vendor performance.
Benefit for Clients: This analysis supports informed vendor management, ensuring a robust and reliable supply chain.
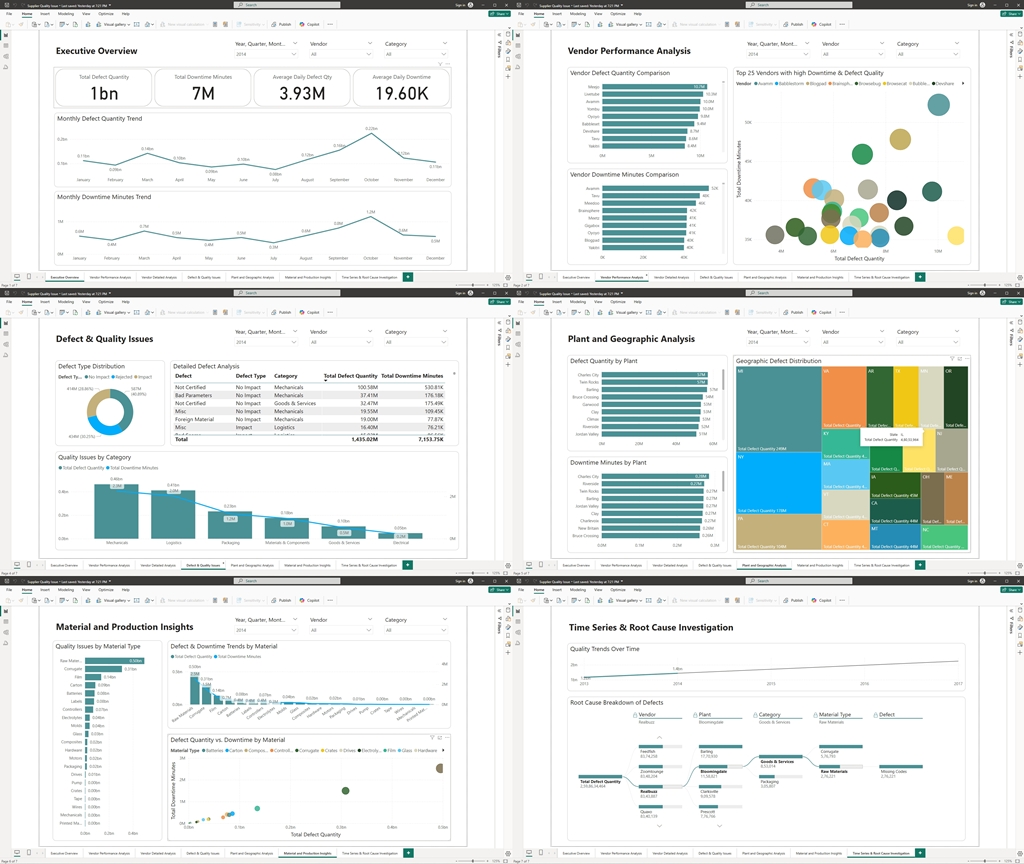
3. Defect & Quality Issues Breakdown
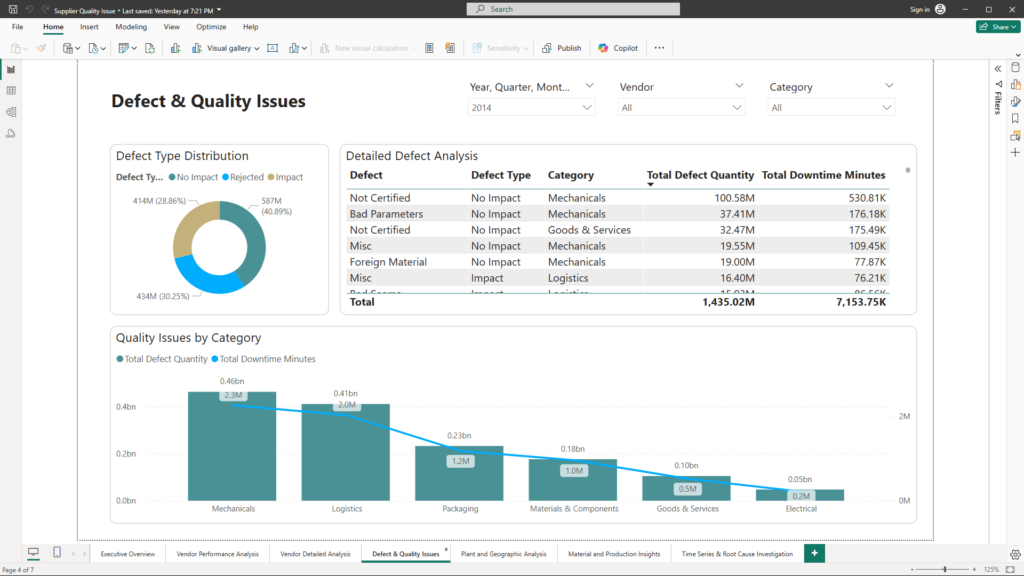
To address quality problems at their source, the analysis breaks down issues by defect type and category:
- Visual Summaries: Donut charts illustrate the distribution of defect types, while detailed matrices list individual defects and their impacts.
- Root Cause Identification: Clear categorization of issues (such as Mechanical or Packaging problems) isolates the most critical areas for improvement.
Benefit for Clients: By understanding where quality issues occur, businesses can concentrate resources on process improvements that yield immediate benefits.
4. Plant and Geographic Analysis
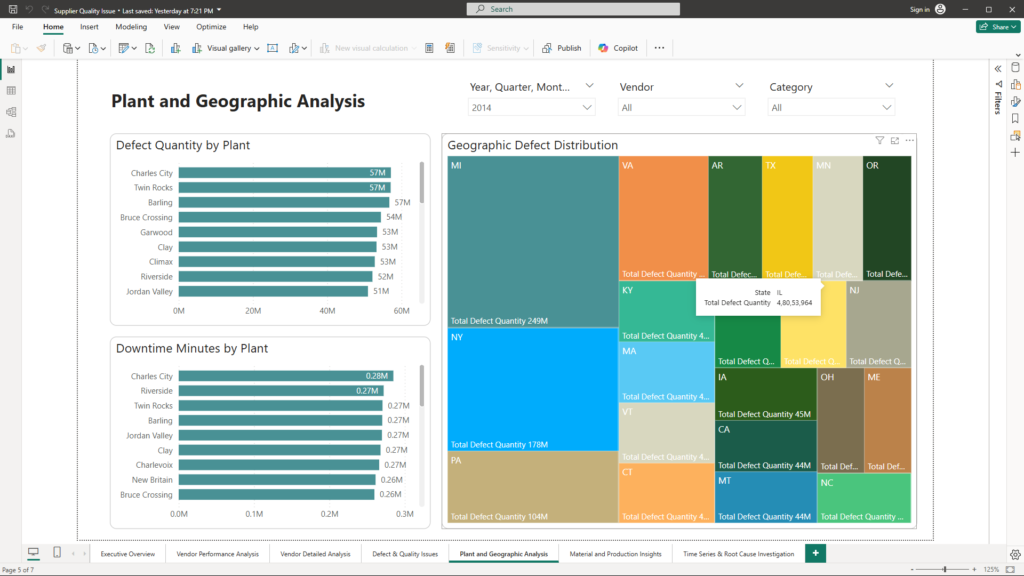
Examining plant-level performance and geographic trends provides valuable insights:
- Plant-Level Dashboards: Interactive maps and bar charts highlight facilities with the most issues.
- Geographic Trends: Slicers based on state or region allow targeted assessments of localized challenges.
Benefit for Clients: This geographic perspective enables targeted interventions, ensuring quality improvements are both effective and efficient.
5. Material and Production Insights
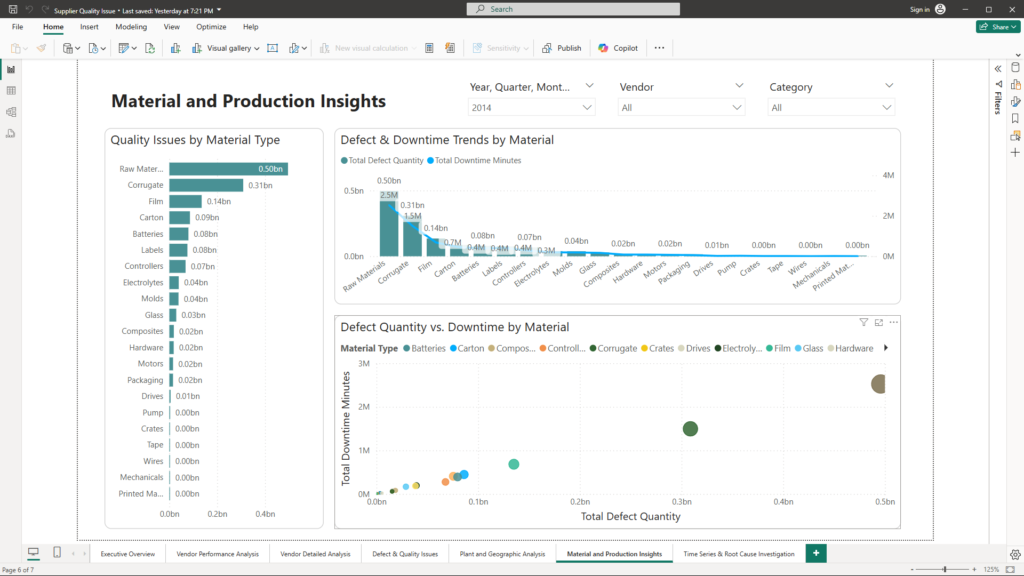
An analysis of materials and production processes reveals underlying quality challenges:
- Material Breakdown: Visualizations assess which materials—such as Batteries or Electrolytes—are most prone to defects.
- Correlation Analysis: Scatter plots uncover relationships between material performance and production bottlenecks.
Benefit for Clients: This insight assists in optimizing production processes and enhancing product quality.
6. Time Series & Root Cause Investigation
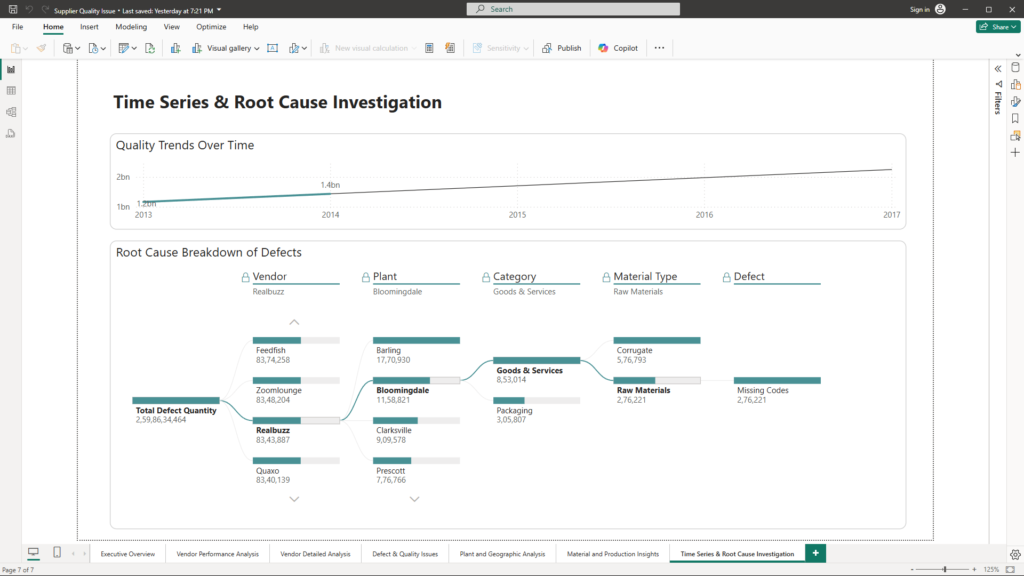
A dynamic time series analysis tracks quality trends and identifies unexpected spikes:
- Temporal Trends: Line charts monitor defects and downtime over time, incorporating forecasting to anticipate future challenges.
- Root Cause Analysis: Decomposition trees enable an in-depth exploration of underlying issues, while dynamic narratives update in real time to explain trends and suggest corrective actions.
Benefit for Clients: This comprehensive view not only identifies problems but also provides context, empowering proactive measures to prevent future issues.
Conclusion
This supplier data analysis case study demonstrates how transforming raw data into clear, actionable insights can drive business success. By focusing on key performance drivers—from vendor quality to material issues—the analysis uncovers hidden challenges and supports strategic decision-making that enhances operational efficiency.
Accompanying this article are screenshots of the interactive dashboards and a screen recording walkthrough that illustrate how these insights come to life. This approach underscores the value of data-driven analysis in making informed decisions that directly impact the bottom line.
Discover how these techniques can be tailored to your unique business needs to drive real value in your operations. Feel free to get in touch at mail@ssghosal.com — I’m here to assist you in unlocking actionable insights for your business.