In today’s fast-paced digital world, every marketing decision counts. I recently embarked on a journey to transform raw marketing data into a compelling narrative—one that not only informs but also inspires strategic action. Using Power BI, I transformed a complex marketing dataset into an interactive dashboard that reveals hidden opportunities and drives smart decision-making.
The Challenge: Navigating a Sea of Data
The marketing campaign generated vast amounts of data—from daily impressions and clicks to conversions, spend, and engagement metrics across multiple channels. However, raw numbers alone rarely tell the whole story. The challenge was to bring clarity to this complexity and present the data in a way that resonates with both top management and the marketing team.
Crafting the Narrative: The Dashboard Storyline
1. Executive Overview: Setting the Scene
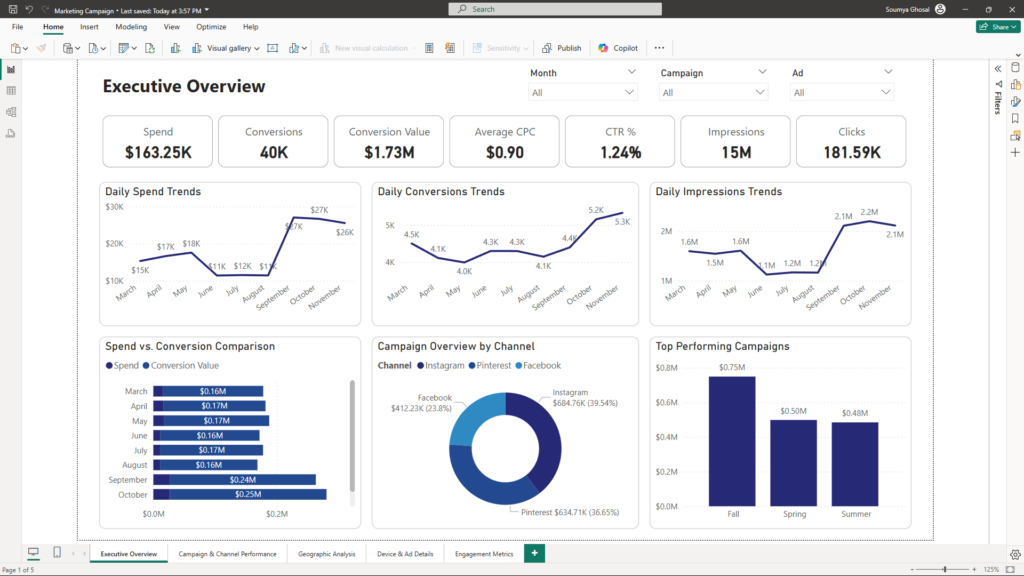
What It Includes:
- High-Level KPIs: KPI cards display key metrics such as Total Spend, Total Conversions, Total Conversion Value, Average Cost-Per-Click (CPC), and Click-Through Rate (CTR).
- Trend Visuals: Line and area charts illustrate daily trends in spend, conversions, and impressions, providing a clear view of performance over time.
Benefits for Stakeholders / Top Management:
This section offers a concise, at-a-glance summary that enables top executives to quickly assess overall campaign health and make high-level strategic decisions without getting lost in the details.
2. Campaign & Channel Performance: The Heart of the Action
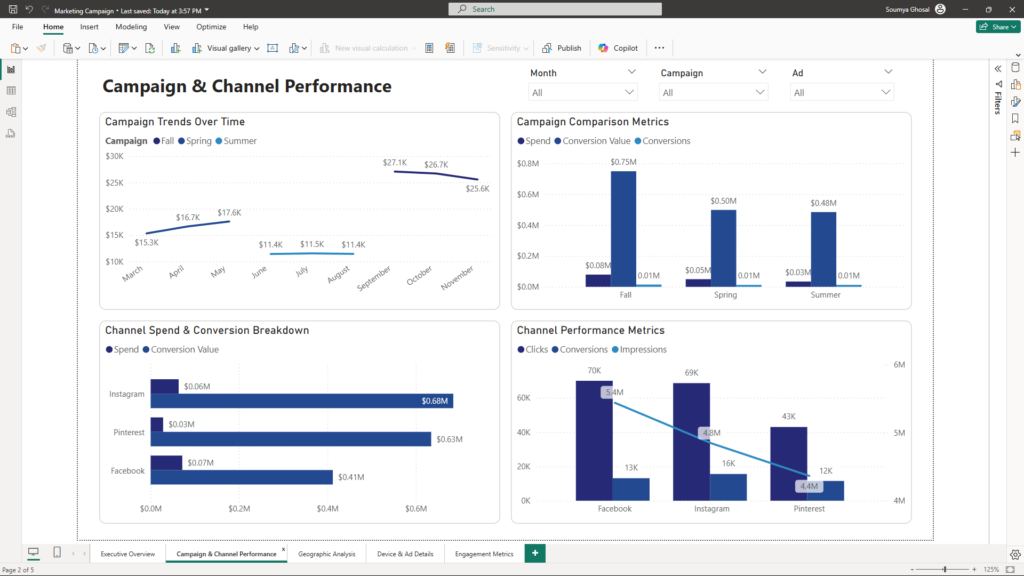
What It Includes:
- Campaign Trends: Interactive line and bar charts visualize daily performance for each campaign, highlighting unique trends and seasonal variations.
- Channel Analysis: Pie and stacked bar charts break down performance by channel, showing how platforms like Facebook, Instagram, and Pinterest contribute to overall success.
Benefits for Stakeholders / Top Management:
By clearly distinguishing between campaign and channel performance, this section allows decision-makers to identify which strategies are working best, allocate resources more effectively, and adjust marketing tactics in real time.
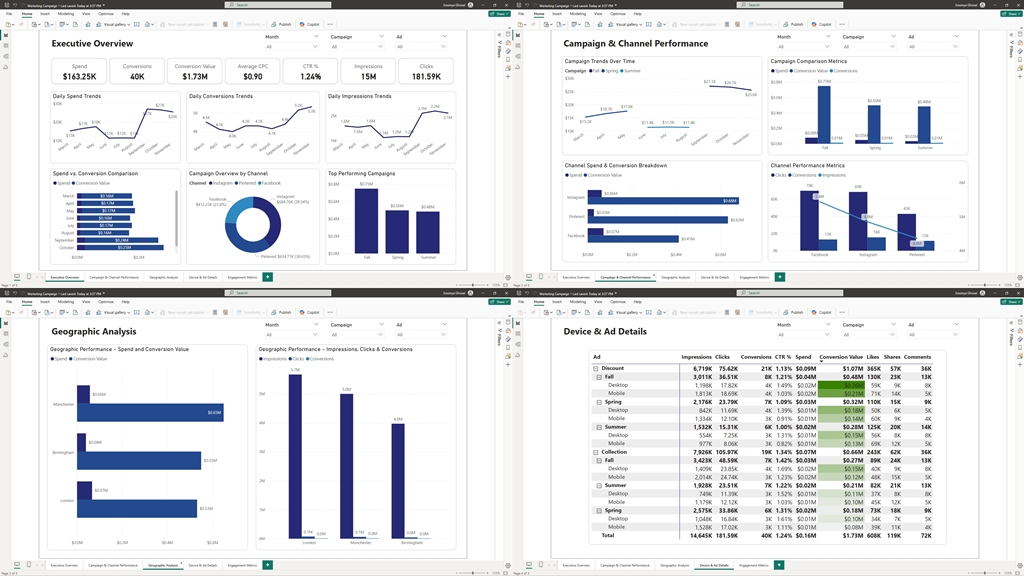
3. Geographic Analysis: Mapping the Impact
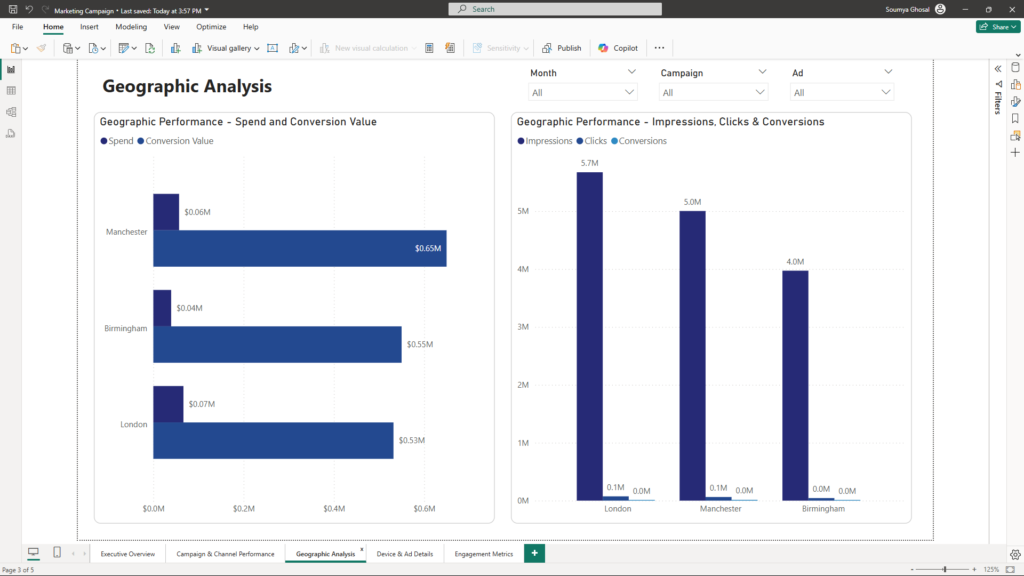
What It Includes:
- Bar Chart – Geographic Performance (Spend & Conversion Value): This visualization highlights regional spending patterns and conversion values, providing insights into where marketing efforts yield the highest returns.
- Column Chart – Geographic Performance (Impressions, Clicks & Conversions): This breakdown showcases key engagement metrics across different locations, helping to identify high-performing regions.
Benefits for Stakeholders / Top Management:
These visualizations offer a clear understanding of geographic performance without the complexity of interactive maps. Decision-makers can quickly assess which regions drive the best results and refine location-based marketing strategies to maximize efficiency and ROI.
4. Device & Ad Details: Uncovering the Nuances
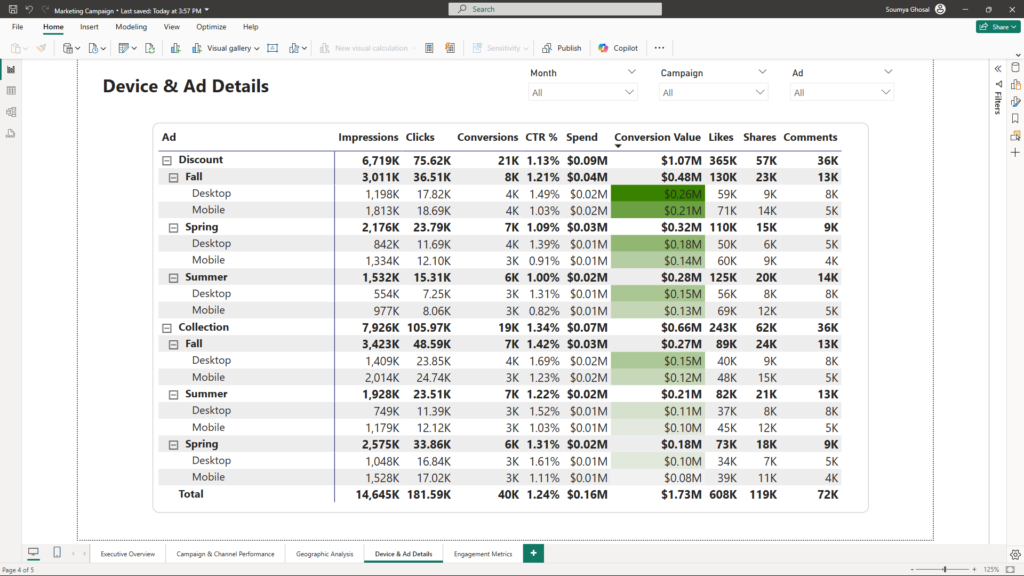
What It Includes:
- Detailed Tables/Matrices: Comprehensive tables display ad-level performance metrics, such as impressions, clicks, spend, and engagement details.
- Drill-Down Capabilities: Interactive drill-down features allow users to explore data further, offering granular insights into the performance of specific ads or devices.
Benefits for Stakeholders / Top Management:
This detailed view supports operational decision-making by uncovering the finer nuances of ad performance, enabling managers to optimize creative and targeting strategies based on solid data.
5. Engagement Metrics: The Voice of Your Audience
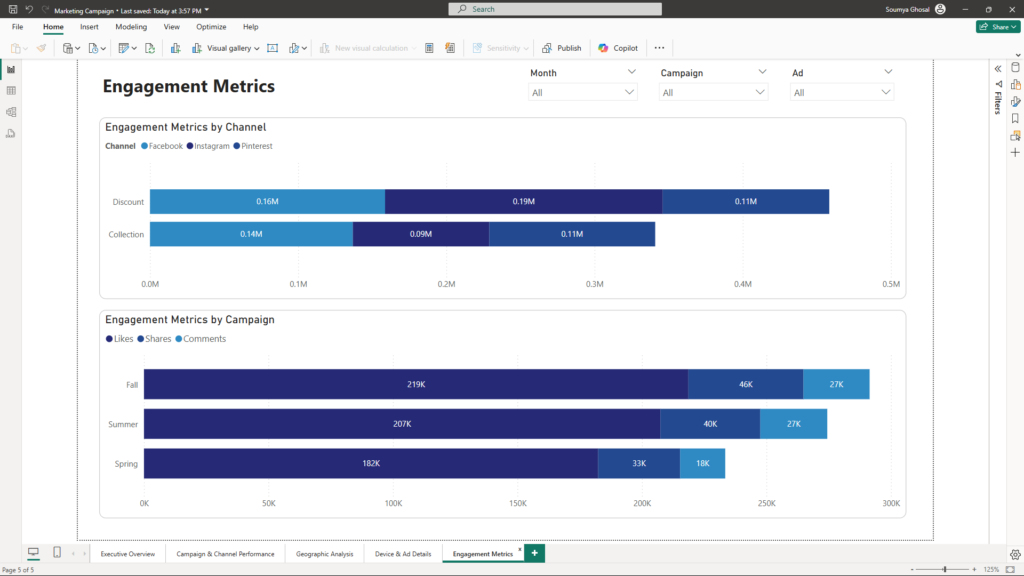
What It Includes:
- Bar and Combo Charts: Visualizations capture audience engagement metrics—likes, shares, and comments—across different ads or channels.
- Dynamic Filtering: Interactive slicers and tooltips allow users to explore engagement trends and understand how different segments of the audience are interacting with the campaign.
Benefits for Stakeholders / Top Management:
Understanding engagement levels helps leaders gauge the emotional and social impact of their campaigns, ensuring that marketing messages are resonating with the target audience and providing a basis for refining future strategies.
Turning Data into Decisions
This Power BI dashboard is more than a collection of charts and numbers—it’s a story that drives action. By blending high-level summaries with detailed, interactive insights, the dashboard empowers both top management and marketing teams to make data-driven decisions that propel the business forward.
If you’re ready to transform your marketing data into a powerful narrative that not only informs but also inspires, let’s connect. Feel free to reach out at mail@ssghosal.com — together, we can turn your data into actionable insights with Power BI.