Introduction
In a dynamic market environment, success hinges on the ability to harness data to drive strategic decisions. Our Pharma Sales Analysis case study transforms complex datasets into a structured narrative that not only monitors performance but also identifies key opportunities and challenges. The insights derived from this analysis are instrumental in refining pricing strategies, optimizing agent performance, and targeting growth areas across markets. By integrating multiple analytical layers, the dashboard serves as a powerful tool for proactive decision-making and operational excellence.
Problem Statement & Business Challenge
Pharmaceutical companies face an array of challenges that impact overall profitability and market positioning. Key issues include:
- Revenue Optimization: Balancing pricing, sales volume, and commission costs to maximize net revenue.
- Market Penetration: Identifying underperforming regions and product segments to allocate resources effectively.
- Operational Efficiency: Assessing the contribution of external sales agents to determine the cost-effectiveness of commission structures.
- Data Integration: Bridging high-level performance insights with granular, actionable details to foster strategic planning across departments.
The Data-Driven Solution
Leveraging advanced data analytics, this comprehensive dashboard provides a multi-faceted view of Pharma Sales performance. By drilling down from overall KPIs to detailed segmentation by market, pricing, and agent performance, the dashboard addresses these challenges through focused, visual analyses. The following sections detail the four core reports that collectively resolve business issues and illuminate pathways for growth:
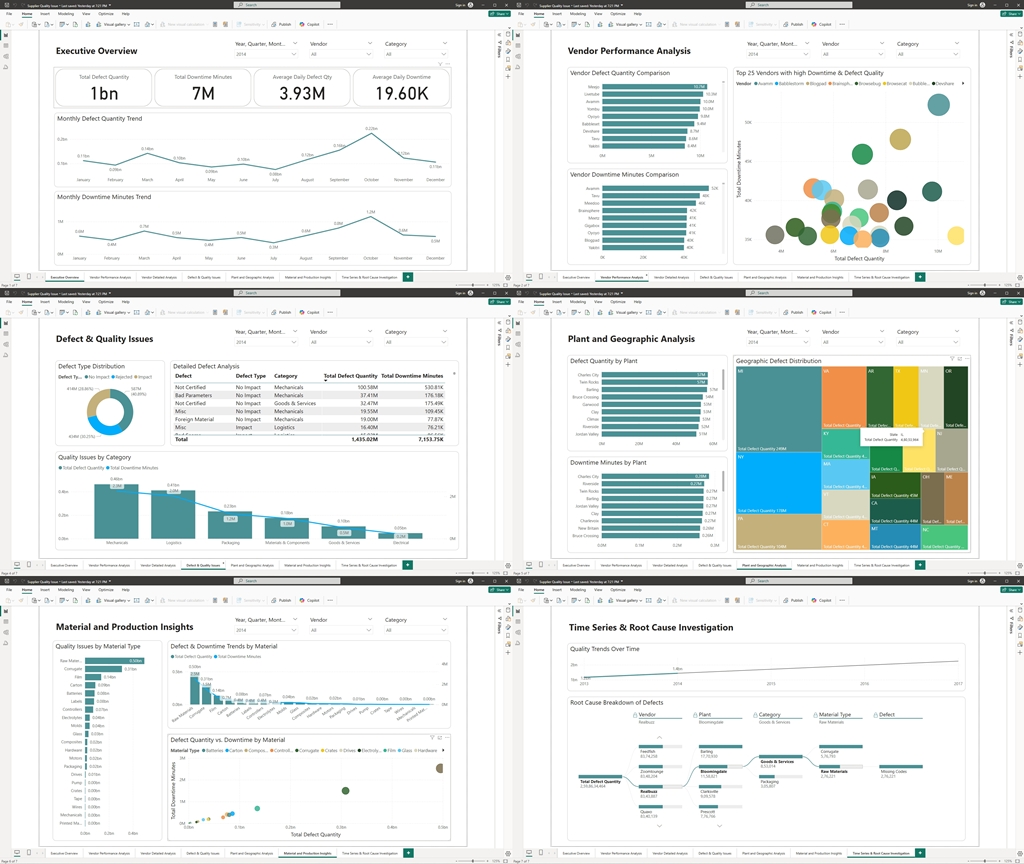
Executive Summary
Purpose: Offer a consolidated overview of financial performance and key operational metrics to swiftly assess business health.
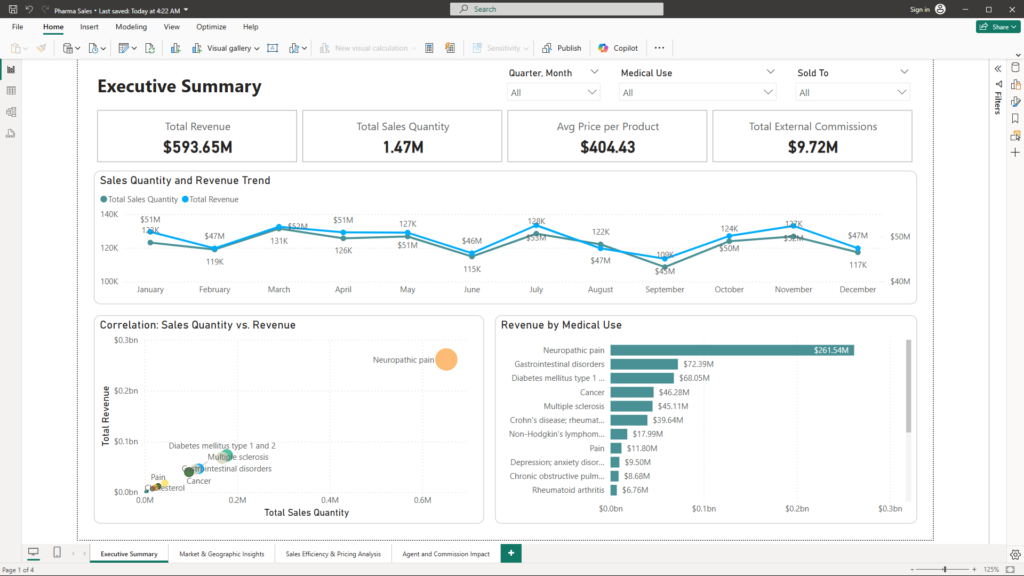
- KPI Cards:
- Total Revenue, Total Sales Quantity, Average Price per Product & Total External Commissions
These metrics provide a rapid snapshot of performance, allowing decision-makers to quickly gauge overall financial strength and cost structures.
- Total Revenue, Total Sales Quantity, Average Price per Product & Total External Commissions
- Sales Quantity and Revenue Trend (Line Chart):
This line chart tracks historical revenue trends while incorporating forecasting elements. It helps uncover seasonal patterns and predict future performance, thereby supporting revenue optimization strategies. - Correlation: Sales Quantity vs. Revenue (Scatter Plot):
By plotting sales volume against revenue, this visual highlights the relationship between these key drivers. Understanding this correlation is critical for fine-tuning sales strategies and pricing models. - Revenue by Medical Use (Bar Chart):
A detailed bar chart disaggregates revenue by therapeutic area, enabling a focused analysis of product performance and guiding targeted marketing efforts.
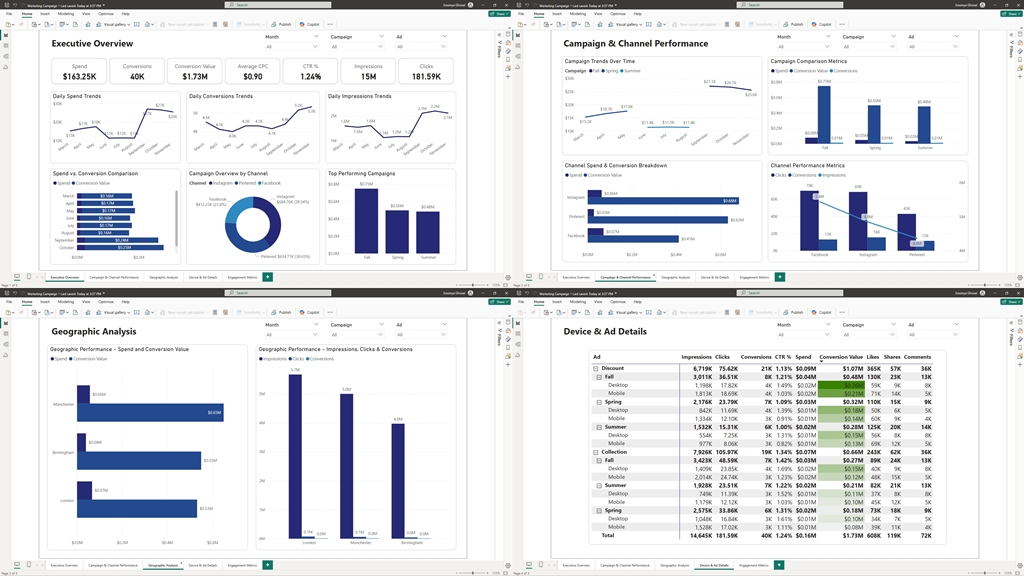
Market & Geographic Insights
Purpose: Delve into regional performance and market segmentation to pinpoint opportunities and drive strategic market expansion.
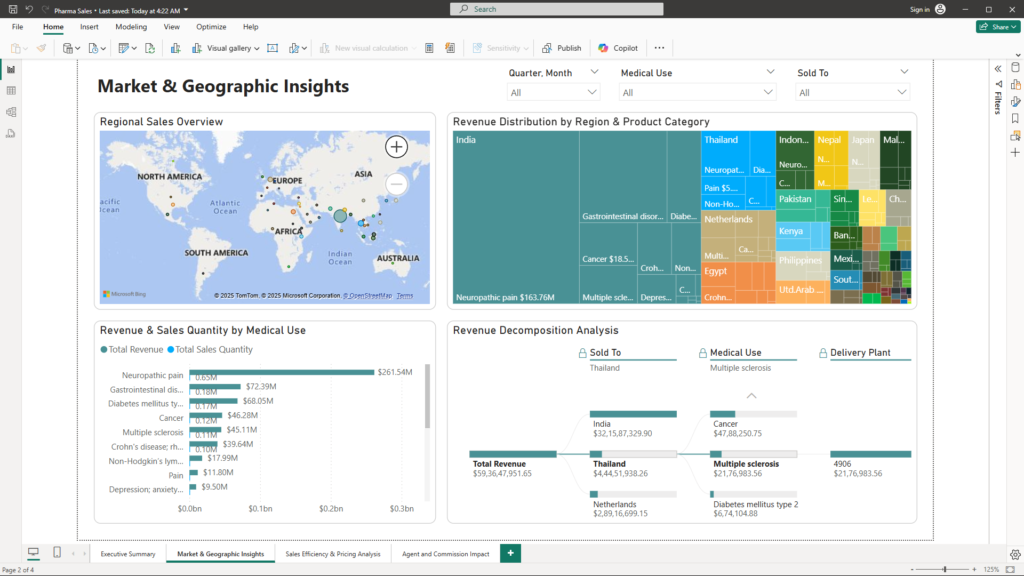
- Regional Sales Overview (Map):
A map visualization offers a geographic perspective on sales distribution. This tool quickly identifies high-performing regions and areas where further investment could yield significant returns. - Revenue Distribution by Region & Product Category (Tree Map):
The treemap provides a hierarchical view of revenue, segmented by geographic and product dimensions. It highlights revenue concentrations and reveals the structure of the market landscape. - Revenue & Sales Quantity by Medical Use (Clustered Bar Chart):
This chart compares revenue and sales volume across different therapeutic areas. The side-by-side visualization aids in recognizing trends and aligning product strategies with market demand. - Revenue Decomposition Analysis (Decomposition Tree):
The decomposition tree breaks down total revenue into its underlying components—such as region, product type, and sales channel. This interactive tool allows managers to drill into specific areas, uncovering the factors that drive overall performance.
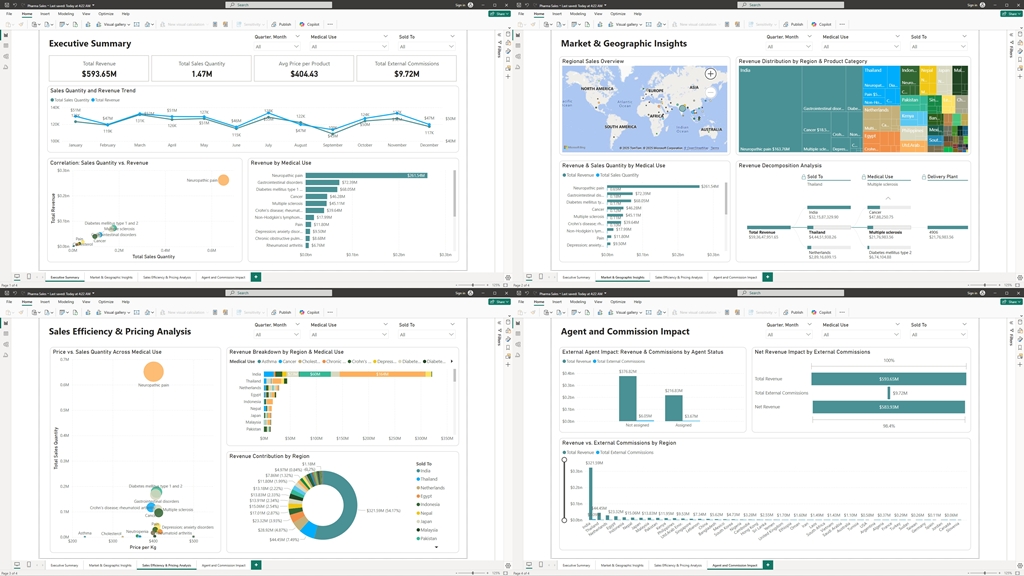
Sales Efficiency & Pricing Analysis
Purpose: Evaluate pricing strategies and sales efficiency to drive improved profitability.
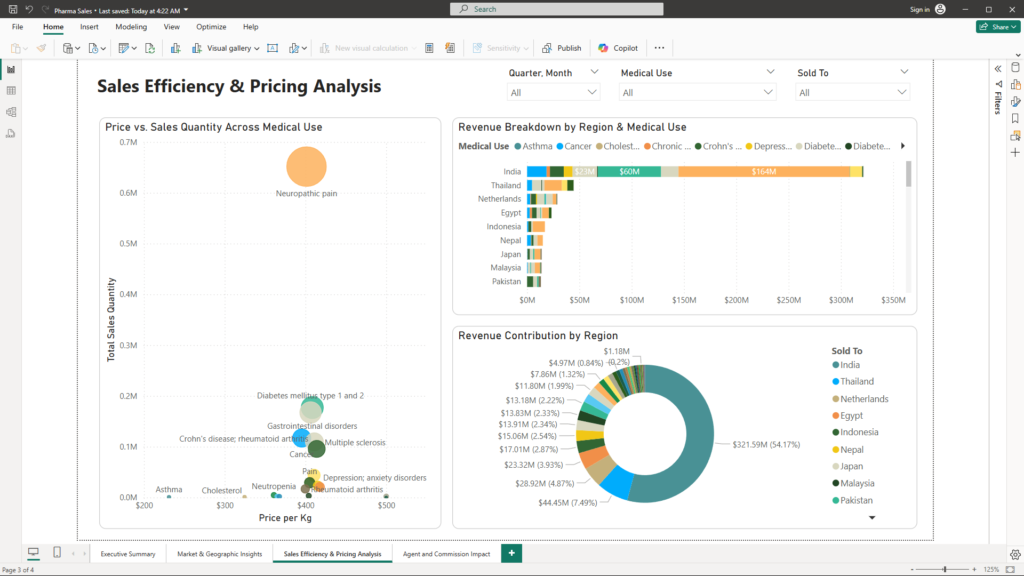
- Price vs. Sales Quantity Across Medical Use (Scatter Plot):
This scatter plot assesses the interplay between pricing and sales volume across various therapeutic categories. The inclusion of segmentation by medical use enables a nuanced understanding of pricing efficiency. - Revenue Breakdown by Region & Medical Use (Stacked Bar Chart):
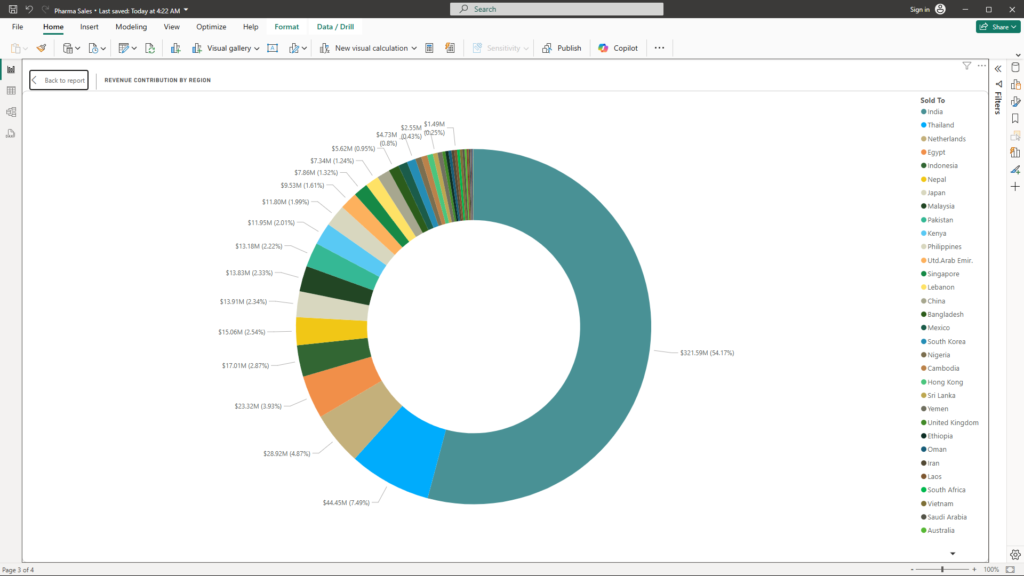
The stacked bar chart partitions revenue by region and therapeutic area. This breakdown is essential for discerning the contribution of each segment, facilitating targeted adjustments to market strategies. - Revenue Contribution by Region (Donut Chart):
A donut chart provides an at-a-glance view of regional revenue shares, highlighting which markets are the primary drivers of revenue. This high-level insight assists in prioritizing market investments.
Agent and Commission Impact
Purpose: Assess the effectiveness of external agents and the impact of commission structures on net revenue.
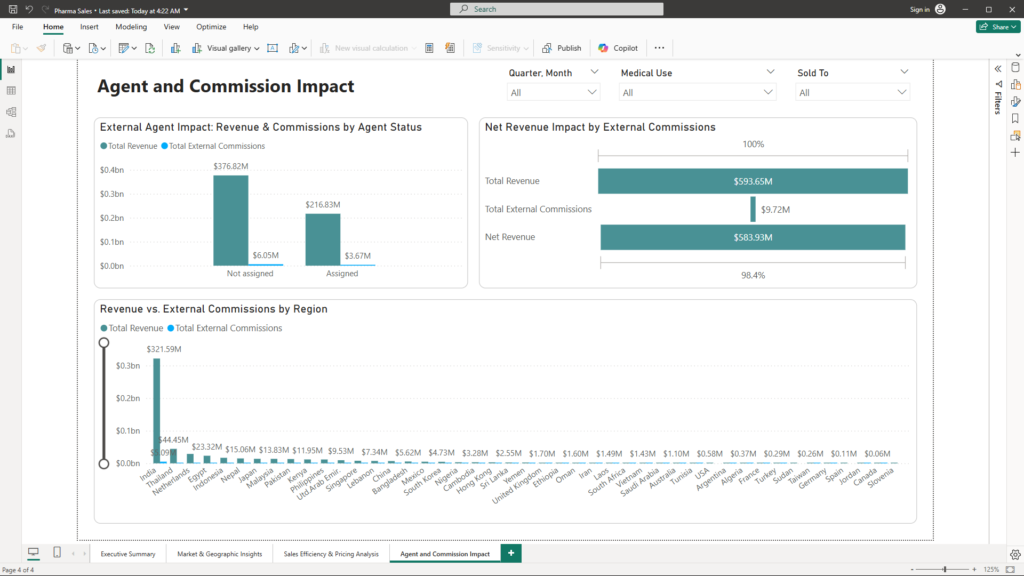
- External Agent Impact: Revenue & Commissions by Agent Status (Clustered Column Chart):
This visual contrasts revenue and commission expenses based on agent status (Assigned vs. Not Assigned). It offers clarity on how agent performance influences overall revenue, guiding commission strategy decisions. - Net Revenue Impact by External Commissions (Funnel Chart):
The funnel chart delineates the step-by-step deduction of external commissions from gross revenue to arrive at net revenue. This sequential view clarifies the financial impact of commission structures and identifies opportunities for cost optimization. - Revenue vs. External Commissions by Region (Clustered Column Chart):
Comparing regional revenue against external commission costs, this clustered column chart highlights areas where commission expenses may be disproportionately affecting profitability. This insight enables targeted interventions to enhance cost efficiency.
Conclusion
The Pharma Sales Analysis dashboard is a game-changer, transforming complex data into a strategic asset that fuels revenue growth and operational excellence. By leveraging cutting-edge Business Intelligence, it unearths hidden patterns, streamlines decision-making, and turns market challenges into growth opportunities. This is more than just analytics—it’s a blueprint for competitive advantage and sustainable success. Discover how this transformative tool can redefine your business strategy at mail@ssghosal.com.